Slow Queries
Rank every query on the database by how much time it consumes, then send the worst one straight into analysis.
Slow Queries answers the first question worth asking when a database feels slow, which is which queries are responsible for the time.
Click Find slow queries. RDST reads the statistics your database already keeps and ranks what it finds, worst first.
This only finds queries your database has actually run. A database with no traffic has nothing to report, and an empty result usually means the workload is idle rather than healthy. Point RDST at a database that is serving real traffic, or generate some before you look.
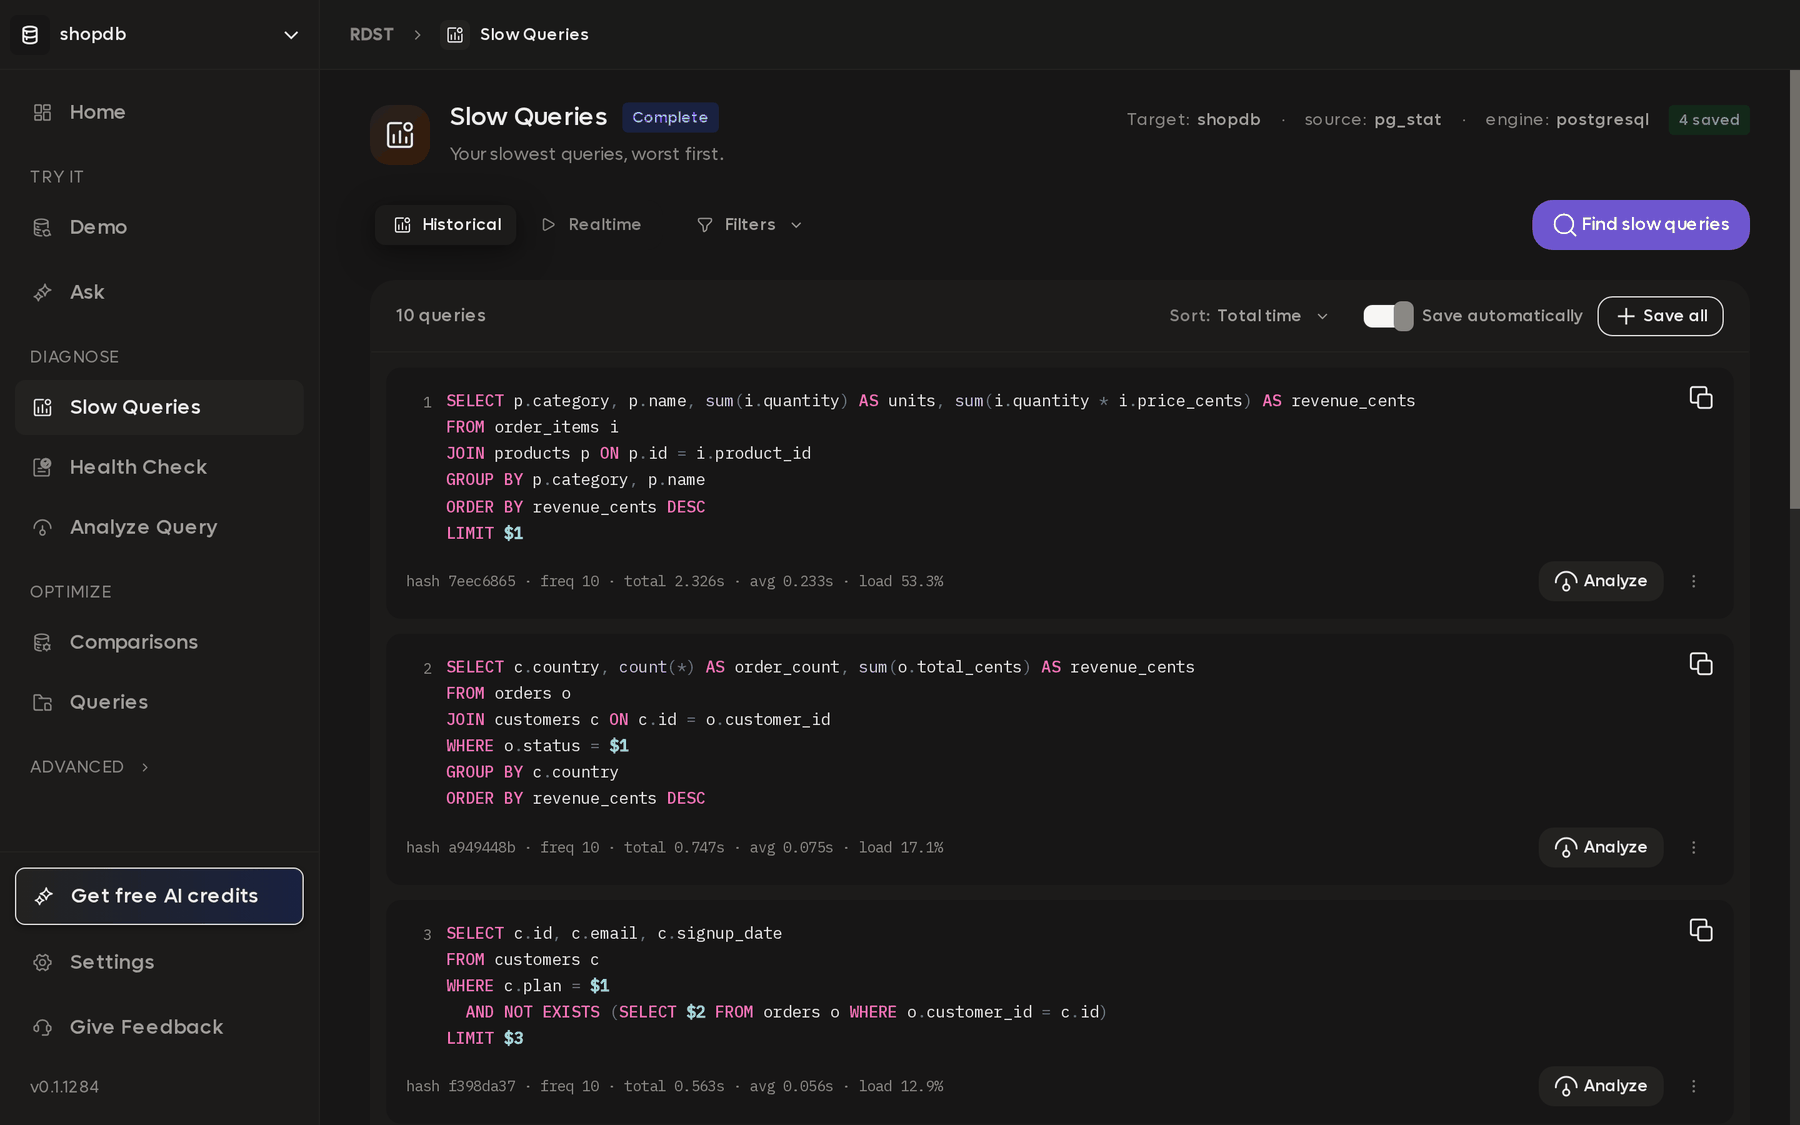
Reading a result row
Each row is one query shape, with the literal values replaced by placeholders, so the same query run ten thousand times with different parameters counts once.
| Statistic | What it tells you |
|---|---|
total | Time this query shape has consumed since statistics were last reset |
avg | Time for a single execution |
freq | How many times it ran |
load | Share of all database time spent on this one query shape |
hash | Stable identifier, so you can follow the same query across runs |
load is usually the number worth acting on. A query averaging 4ms that runs a
hundred thousand times an hour costs more than one taking 2 seconds twice a day,
and sorting by total time rather than average is what brings it to the top.
Analyze on any row carries that query into Analyze Query.
Historical and realtime sources
Historical is the default and reads the statistics your database accumulates
over time: pg_stat_statements on PostgreSQL, performance_schema on MySQL.
This is what you want almost always, because it covers a long window rather than
the moment you happened to look.
Realtime samples what is executing right now, from pg_stat_activity or
SHOW PROCESSLIST. Reach for it when something is on fire this minute, or when
you want to catch a query that has not finished yet.
The header shows which source produced the results, next to the target name and engine.
Historical mode needs query statistics enabled. On PostgreSQL that is the
pg_stat_statements extension; on MySQL it is performance_schema. If it is
not available, RDST says so and Realtime still works. A
health check flags this too,
because a database without query statistics is hard to diagnose in general.
Automatic saving
Save automatically is on by default, so every scan writes its results to Queries. You do not need to click anything, and a query that showed up once at 3am is still there in the morning. The counter in the header tells you how many of the current results are already saved.
Save all is there for when you have turned the toggle off and want this particular run kept anyway.
This matters because query statistics are not permanent. A restart, a failover,
or someone calling pg_stat_statements_reset() clears them. Anything already in
Queries survives that.
Filters narrows the list, which is worth doing on a busy database where the top is dominated by one noisy application.