Health Check
Produce a full report on a database: sizing, configuration, indexes, the queries costing you the most, and what to do about them. Run it against one database or several at once.
A health check is the report you want when you have inherited a database, when something has been slowly getting worse, or when someone asks how things are going and you would rather answer with evidence.
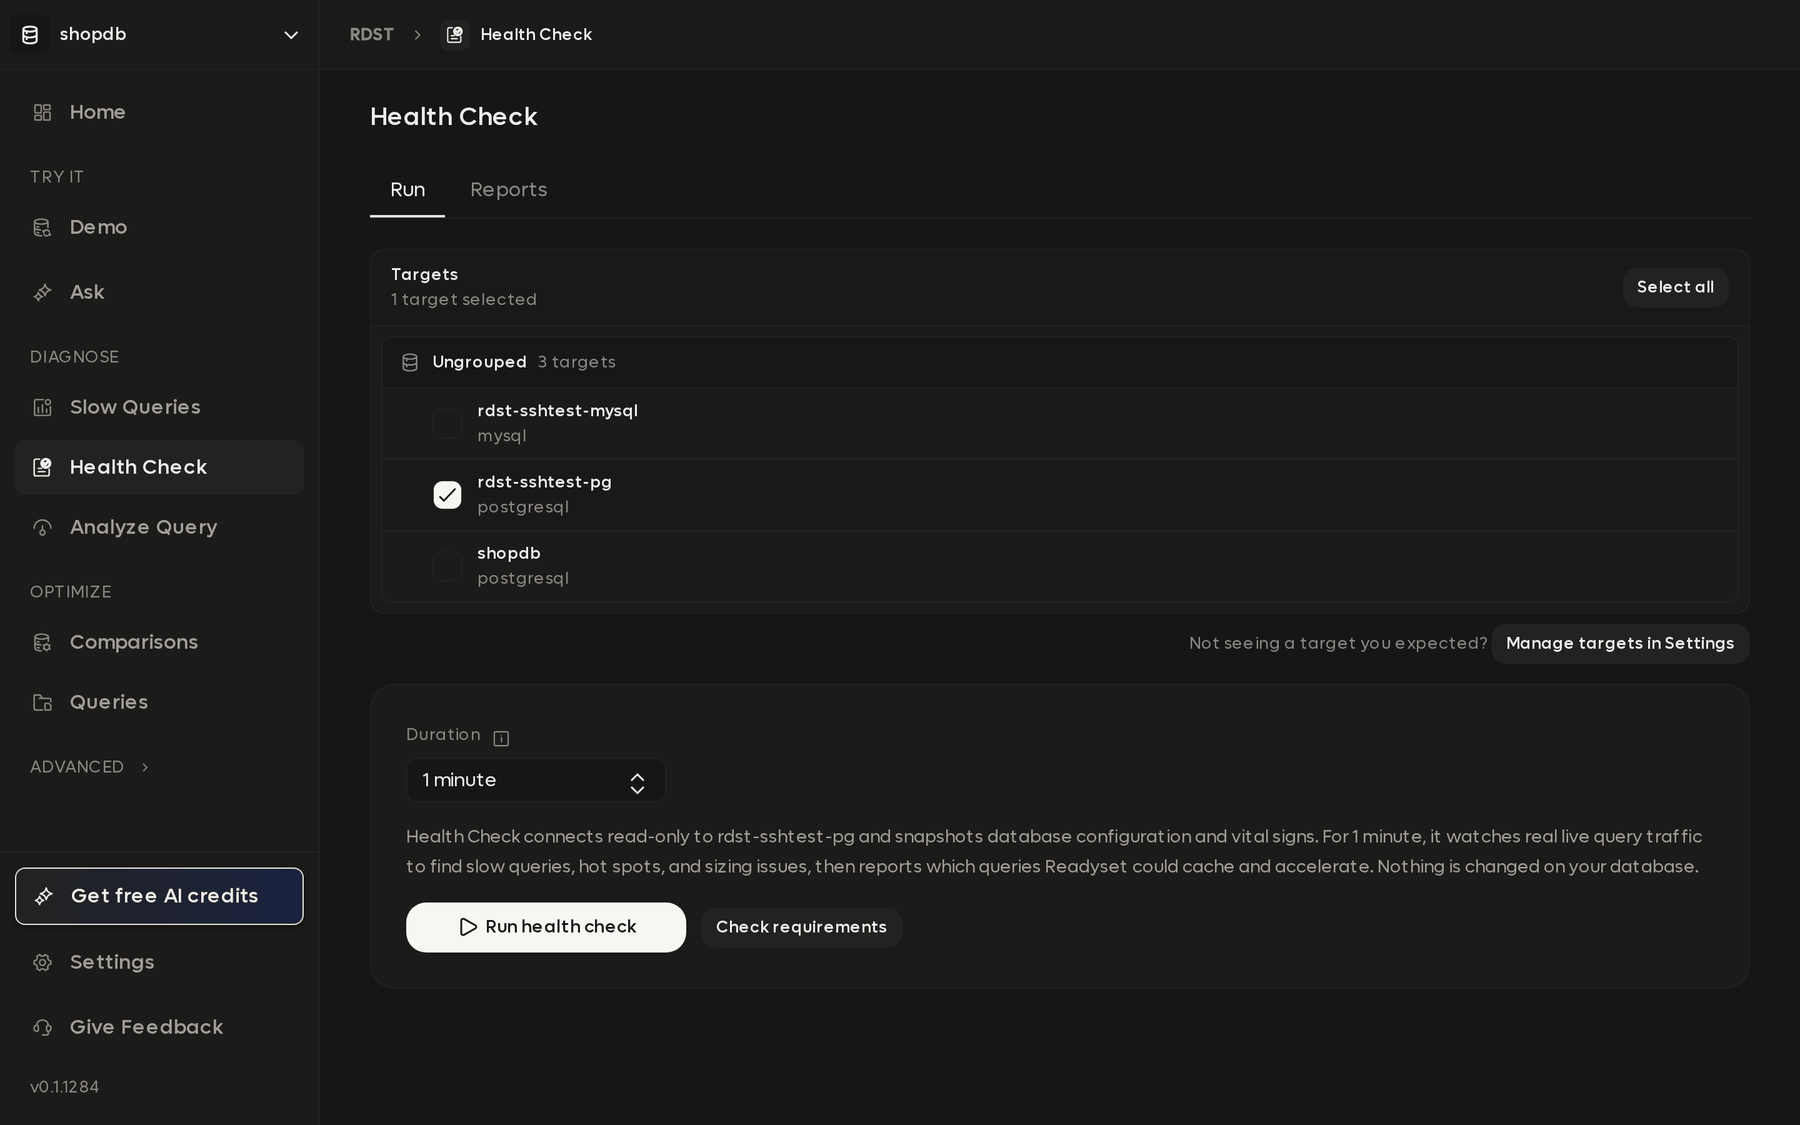
Running a check
Pick the targets. Tick one database, or several. Select all takes every target you have. Running against many at once is the same operation the CLI calls a fleet audit, and it is the same screen here.
Choose a duration. This decides whether RDST also watches live traffic, which is explained below.
Run health check. Progress streams as it goes, so you can watch each stage land rather than staring at a spinner.
Duration and live capture
With no duration, RDST reads what the database already knows: version, size, connection pool state, cache hit rate, read and write mix, instance sizing, index coverage, and the historical query statistics. This finishes quickly.
With a duration, RDST additionally watches the database for that long and records every query that actually runs, with real wall-clock timings. That is a different and better signal, because historical statistics tell you what has been expensive since they were last reset, while a live capture tells you what is happening now.
A short window is genuinely useful. Thirty seconds during normal traffic will surface the queries your application actually issues. Longer windows catch periodic work, like a job that runs on the hour.
RDST only reads during the capture window. It polls pg_stat_activity or
SHOW PROCESSLIST and writes nothing to your database. Running a health check
against production is safe, and is what it is designed for.
The report
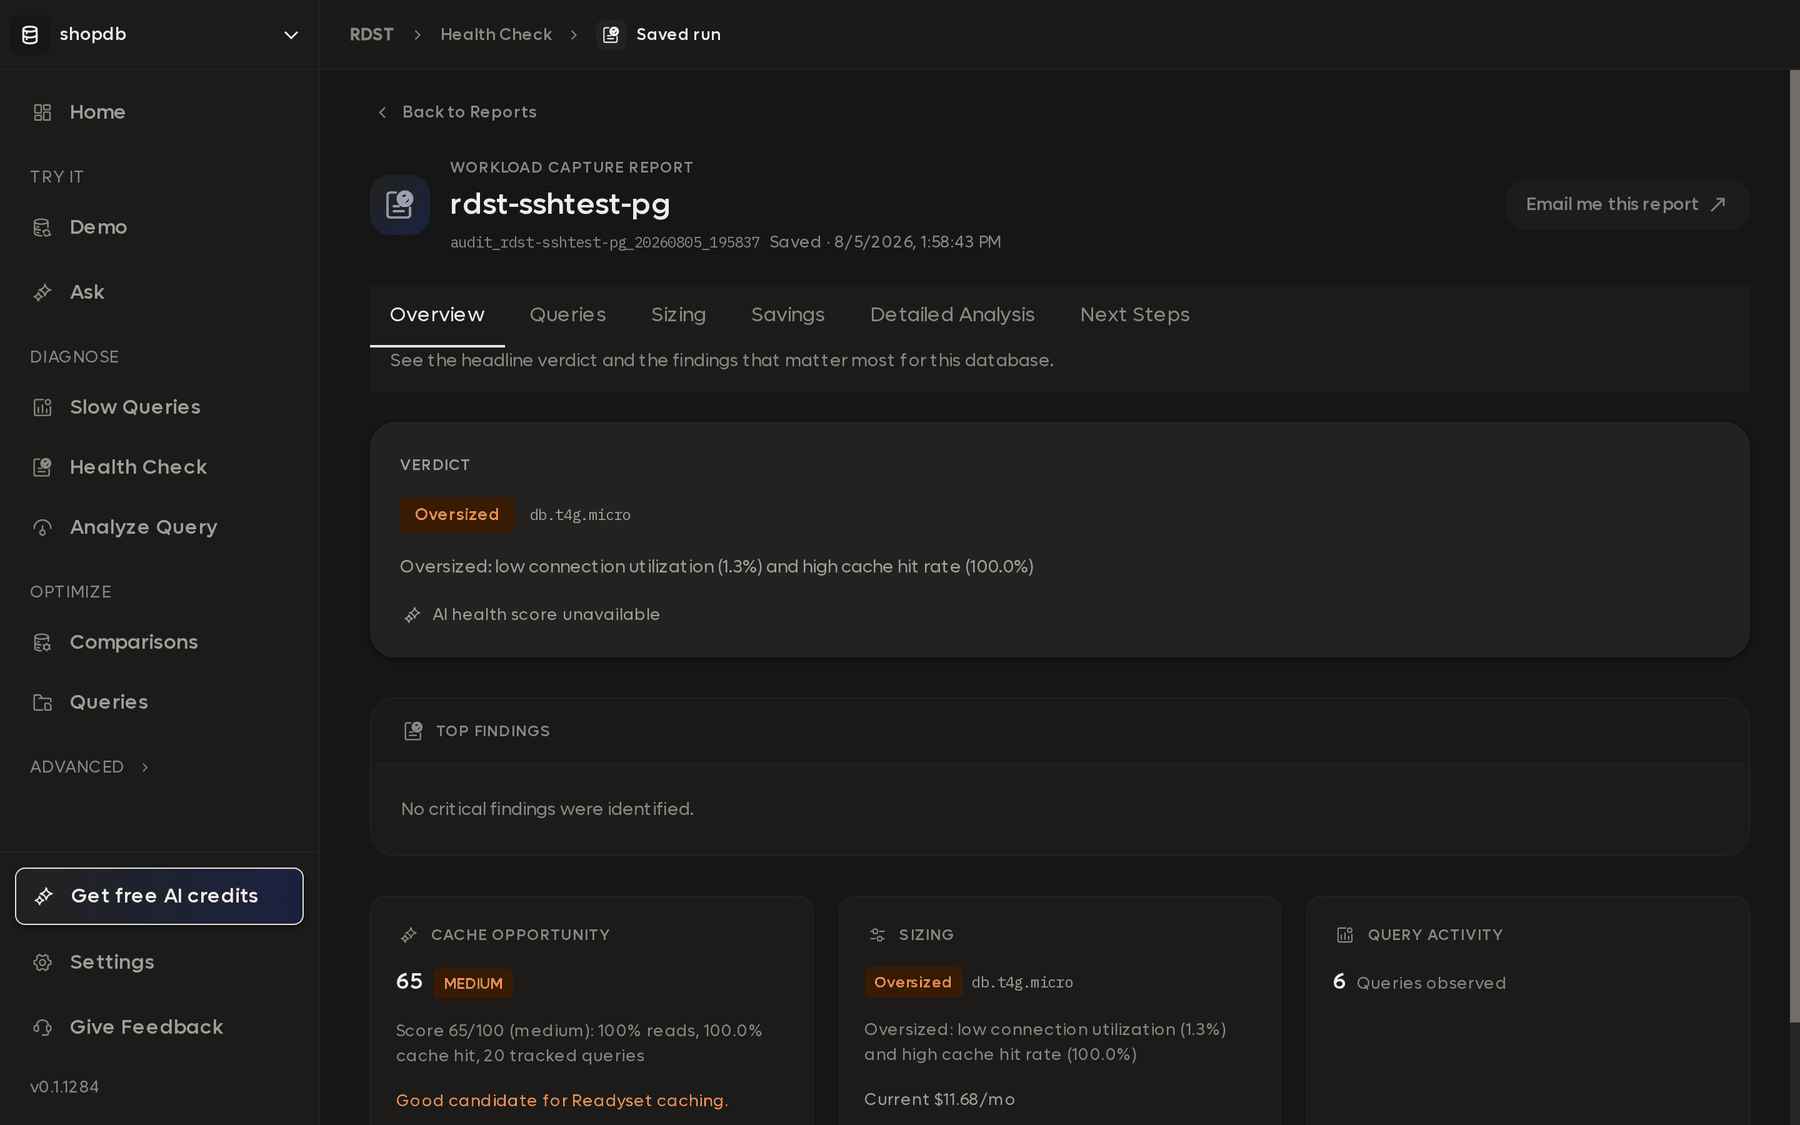
The report opens on a verdict and splits into six tabs.
| Tab | What it tells you |
|---|---|
| Overview | The headline verdict and the findings that matter most |
| Queries | Every query observed during the run, ranked, each with Analyze and Compare with Readyset |
| Sizing | Whether the instance is oversized, right-sized, or under-provisioned |
| Savings | What the workload would cost with caching in place |
| Detailed Analysis | The full written read of the workload |
| Next Steps | Everything above, turned into an ordered list of things to do |
Sizing is specific on AWS
When the target was imported from AWS, RDST knows the instance class and can be
concrete: the report above says Oversized, names db.t4g.micro, gives the
reasoning (1.3% connection utilization, 100% cache hit rate) and puts the current
cost at $11.68 a month.
For a database RDST cannot identify the hardware of, sizing falls back to what it can infer from utilization alone.
Queries
The Queries tab is the run's real output: what your application actually sent during the window, ranked by the time it cost.
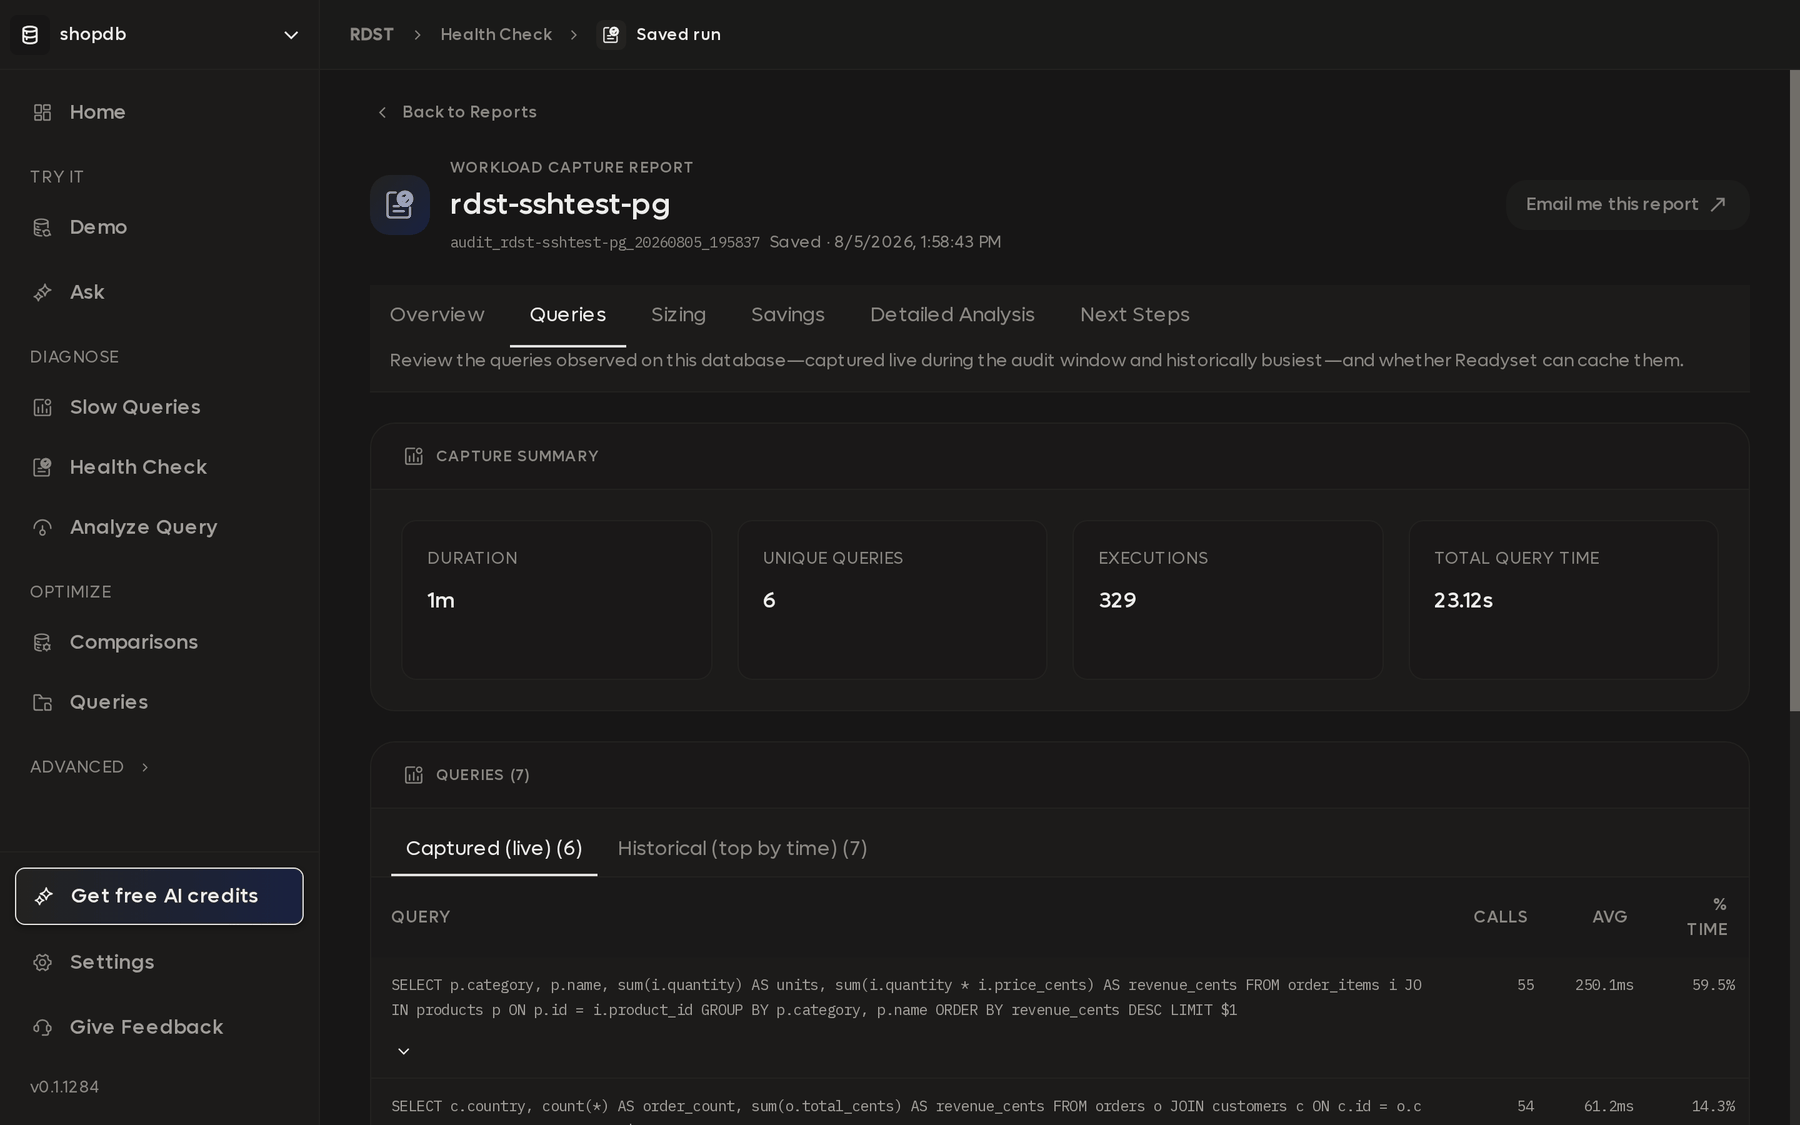
Every one of them is analyzable in place, and each is already saved to Queries.
Next Steps
Next Steps is the tab to read first. Everything else is the evidence behind it.
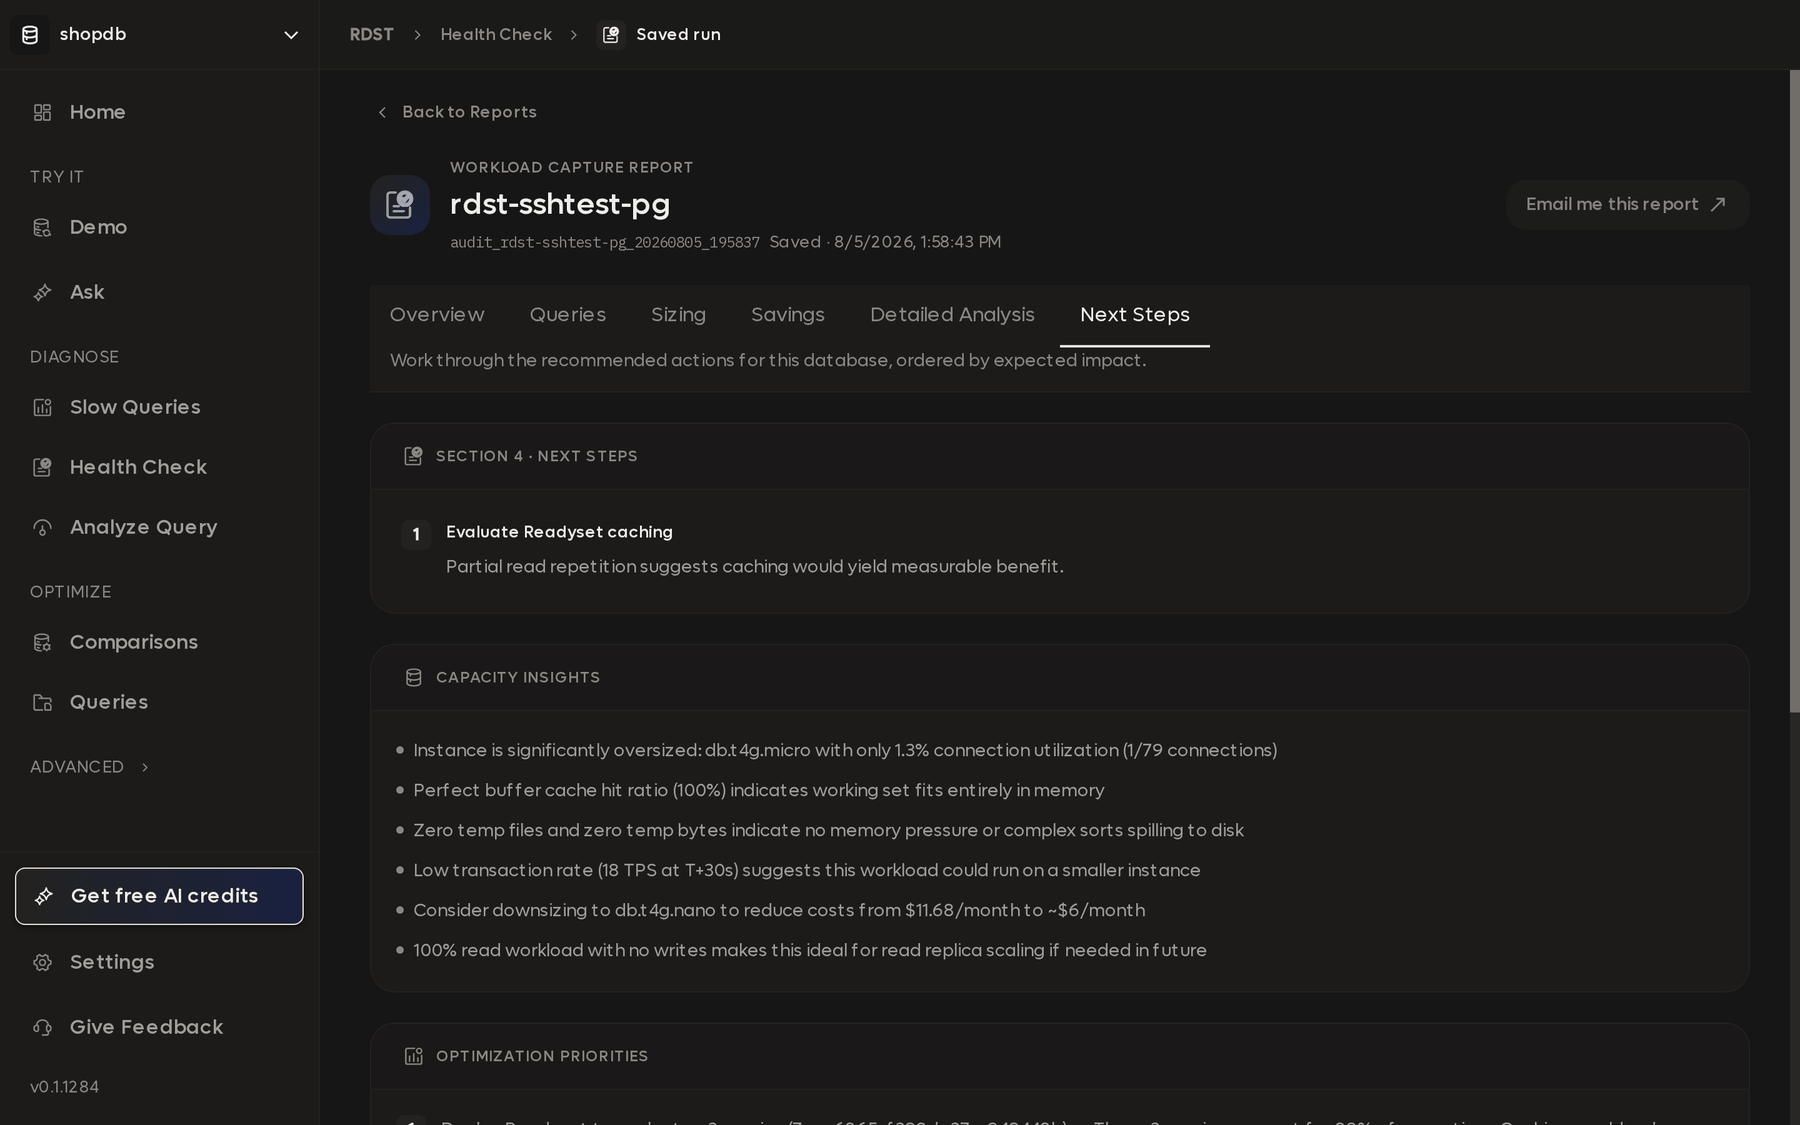
Each priority carries a category, an effort estimate, and an expected impact, so a low-effort high-impact index change is easy to pick out from a larger migration.
Email me this report sends the whole thing, which is usually easier than asking someone to come and look at your screen.
Fleet and Aurora clusters
Ticking more than one target runs the same check across all of them. You get a report per database, plus an analysis layer over the whole set.
That combined layer is the reason to do it, and it matters most for an Aurora cluster. The writer and its readers serve one application, so the queries are related and read traffic is split across the readers. Check a single reader and you see a slice: some of the queries, some of the time, and a load profile that does not resemble the cluster's. Check them together and RDST can attribute traffic across the whole cluster, spot a query that is only expensive on one node, and score cache opportunity against the real total rather than a fraction of it.
The same applies to any group of databases serving one system, like a sharded fleet or a set of per-tenant databases.
The CLI calls this
rdst fleet audit. It is
the same operation, and reports land in the same place.
Saved reports
The Reports tab keeps every health check you have run.
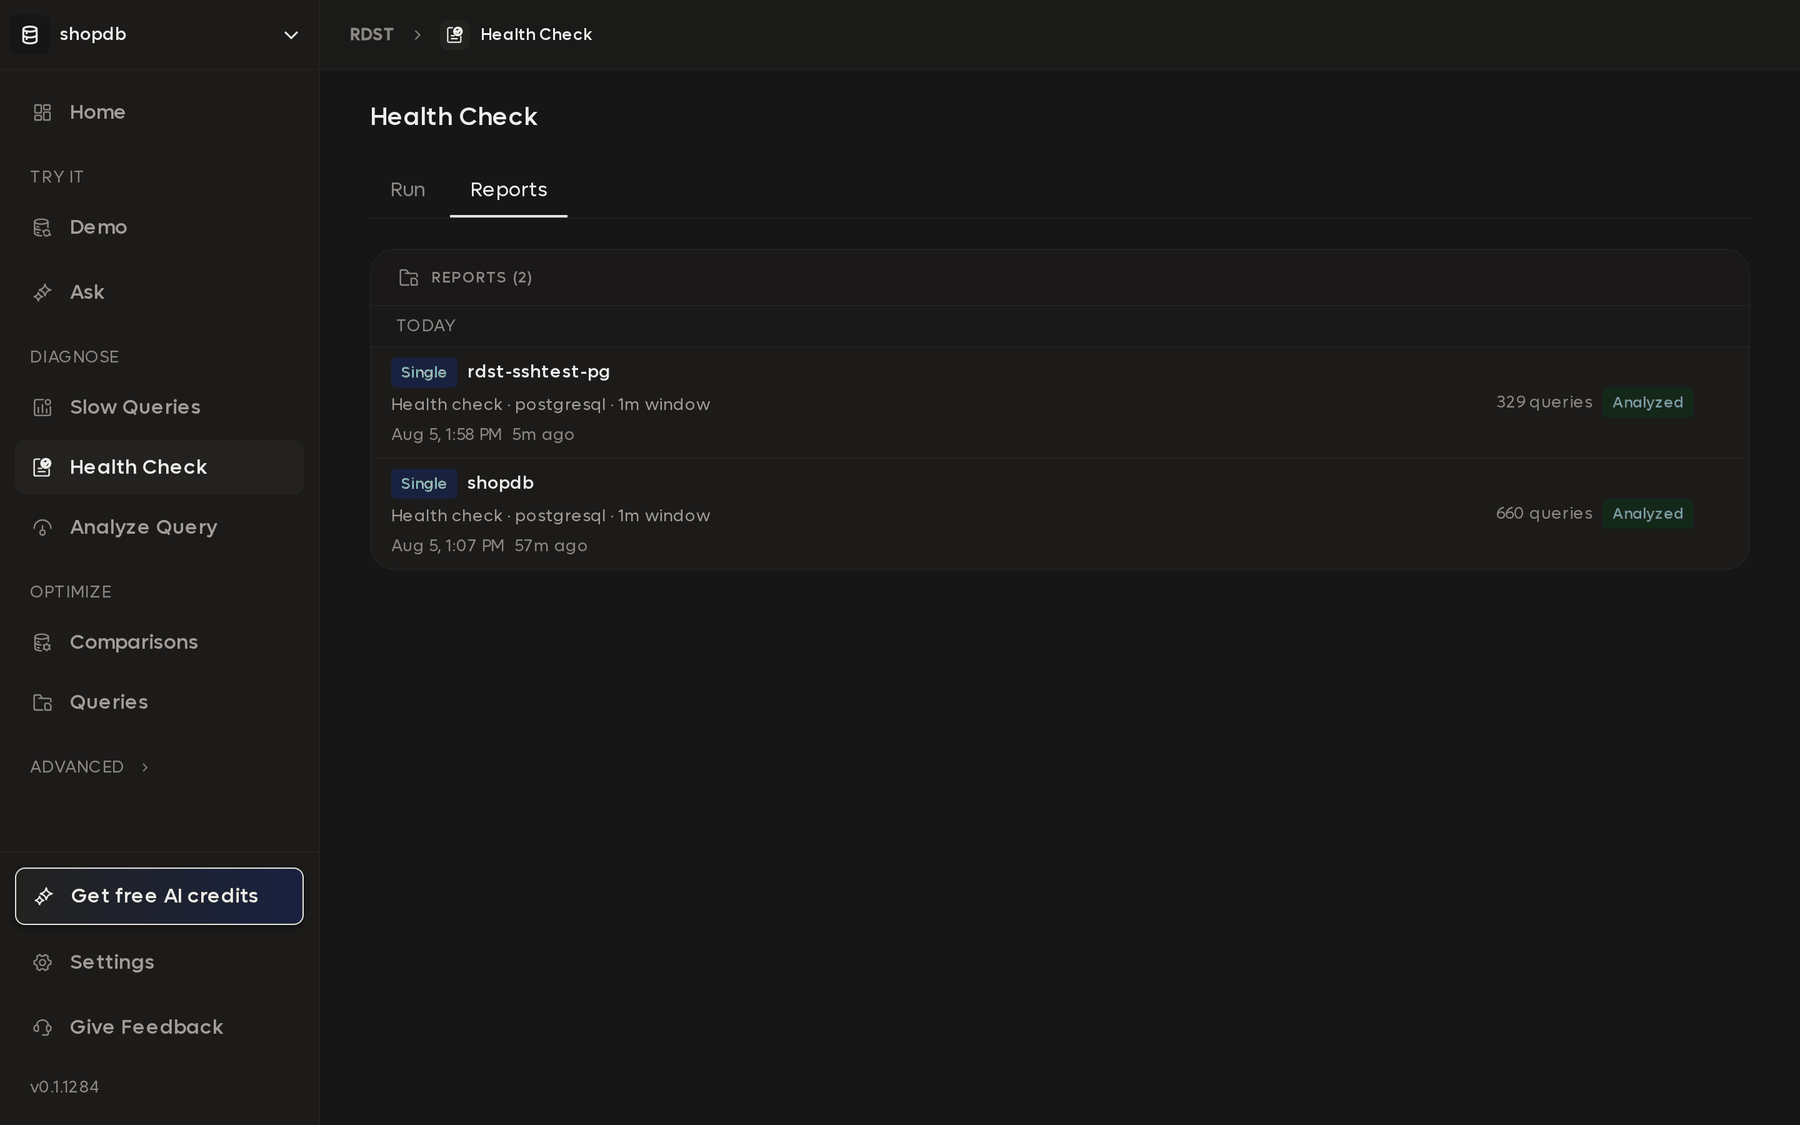
Each one is a snapshot of the database at that moment, which makes them useful in two ways beyond reading the latest.
Comparison over time. Run one now and one in a month and the differences are the story: a table that tripled, an index that stopped being used, a query that appeared out of nowhere.
Something to hand over. A report reads as a formatted page rather than terminal output, which makes it the thing to send to someone who did not run it.
The written sections of the report need LLM access. The collected metrics, sizing, and query statistics do not, so without a key you still learn that the instance is oversized and which queries cost the most. See AI credits and API keys.
From the command line
A health check here is rdst audit
for one database and
rdst fleet audit for
several. Reports are stored in the same place, so a check you run in the app shows
up in the CLI and the reverse.
Use the CLI when you want this on a schedule, want the report emailed, or want to diff two snapshots programmatically.
Analyze Query
Everything RDST knows about one query: what the planner does with it, where the time goes, which index would help, and how it could be rewritten.
Ask
Ask a question about your data in plain English and get the answer back. RDST writes the SQL, checks that it is safe and valid, runs it, and shows you the rows.