RDST Desktop
A SQL performance toolkit for PostgreSQL and MySQL that connects straight to your database, finds the queries costing you the most, and explains in plain English what to change. Runs on macOS, Windows, and Linux.
When an application slows down, the database gets the blame, and the cause is usually a small number of queries doing far more work than anyone realized. Finding out which ones, and why, is the difficult part.
RDST connects directly to your PostgreSQL or MySQL database to answer that. It
works something like htop for your SQL workload, with a reasoning layer that
turns an execution plan into an explanation you can act on.
Download RDST Desktop for macOS, Windows, or Linux, then follow Get Started to set it up.
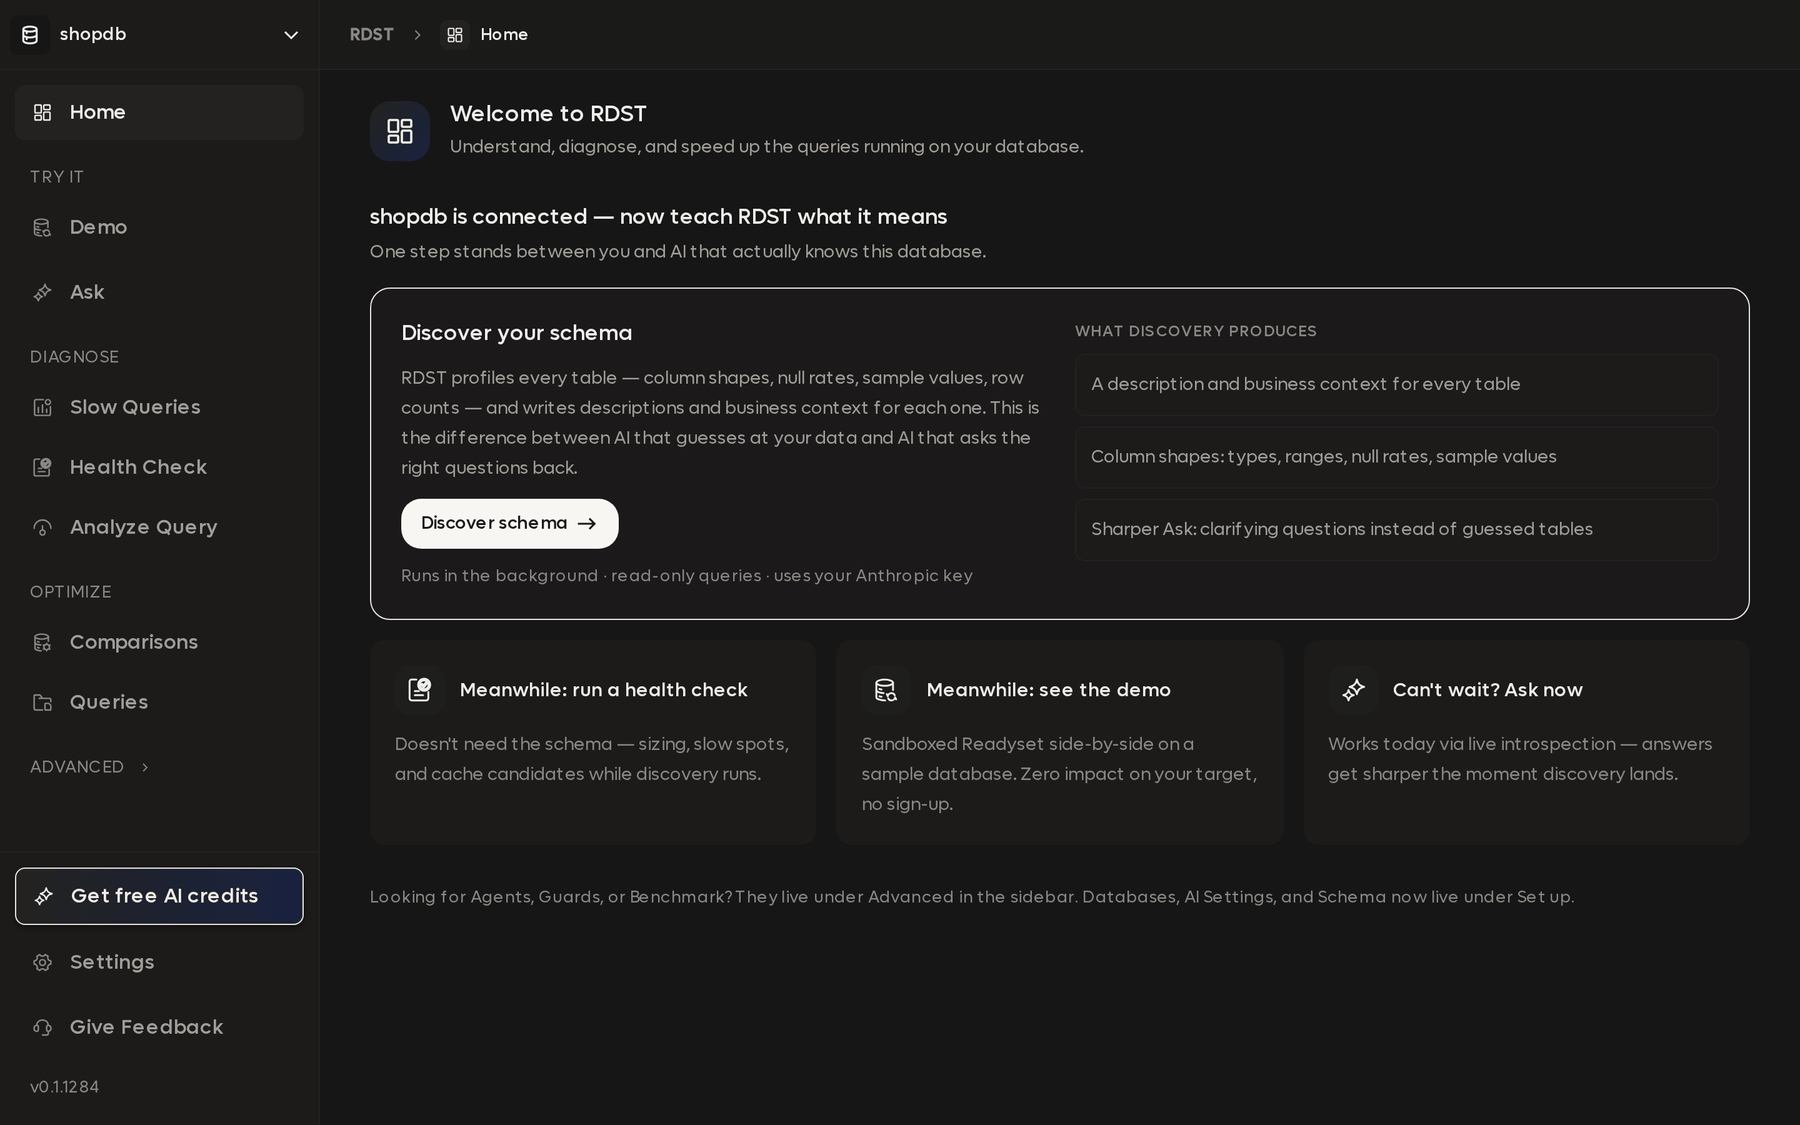
Recommendations are grounded in your own execution plans, schema, and runtime statistics rather than in general advice, and RDST will tell you when a query is already performing well.
Nothing you do writes to your database. RDST issues read-only diagnostic queries:
EXPLAIN, EXPLAIN ANALYZE, pg_stat_statements, performance_schema, and
pg_stat_activity or SHOW PROCESSLIST for live monitoring.
Everything runs locally against your own database. See Privacy and data handling for what is stored, what reaches an LLM, and what never leaves your machine.
Where to start
Get Started
macOS, Windows, and Linux builds. Or run the same interface in a browser where you cannot install software.
Connect a database
Import from AWS, sign in to Supabase, Neon, or DigitalOcean, or reach a private database through an SSH jump host.
Diagnose
Find the queries costing you the most, analyze one in depth, and run a full health check.
AI credits
The reasoning layer needs an LLM. Claim free credits in the app or bring your own Anthropic key.
The sidebar
The sidebar is ordered roughly the way you work: connect a database, find out what is slow, then decide what to do about it.
| Sidebar | What it is for |
|---|---|
| Home | What is connected, and what to do next |
| Demo | A sandboxed Readyset against a sample database. Nothing touches your data and no sign-up is required |
| Ask | Ask a question about your data in plain English and get the answer |
| Slow Queries | The queries consuming the most database time, worst first |
| Health Check | A full report on one database or a whole fleet |
| Analyze Query | Everything about one query: plan, cost, indexes, rewrites |
| Comparisons | Measure a Readyset cache against your database |
| Queries | Every query the app has collected, in one place |
| Schema | The semantic layer: what RDST knows about your database beyond column types |
| Advanced | Code Scan, Agents, and Guards |
| Settings | Database connections, API keys, and local data |
Requirements
| Requirement | Notes |
|---|---|
| The app | Download it for macOS, Windows, or Linux |
| A database | PostgreSQL 13+ or MySQL 8.0+ |
| A user to connect as | Read-only is enough, and is what we recommend |
| LLM access | Free credits claimed in the app, or your own Anthropic key |
| Optional | Docker, for the Demo and for local Readyset cache deploys |
The app and the CLI are the same tool with two front
ends. They share ~/.rdst/config.toml, the same query registry, and the same
saved health reports. A database you add in the app is available to rdst in
the next command you run, and the reverse.