Analyze Query
Everything RDST knows about one query: what the planner does with it, where the time goes, which index would help, and how it could be rewritten.
Analyze Query takes a single query and tells you why it costs what it costs.
Analyzing is available anywhere the app shows you a query. Every row in Slow Queries has an Analyze button, so does every entry in Queries and every query listed in a health report. You can also open the screen directly and paste SQL in.
The written analysis, the index recommendations, and the rewrites are generated and need LLM access. The plan, the timings, and the row counts come from your database and work without it. See AI credits and API keys.
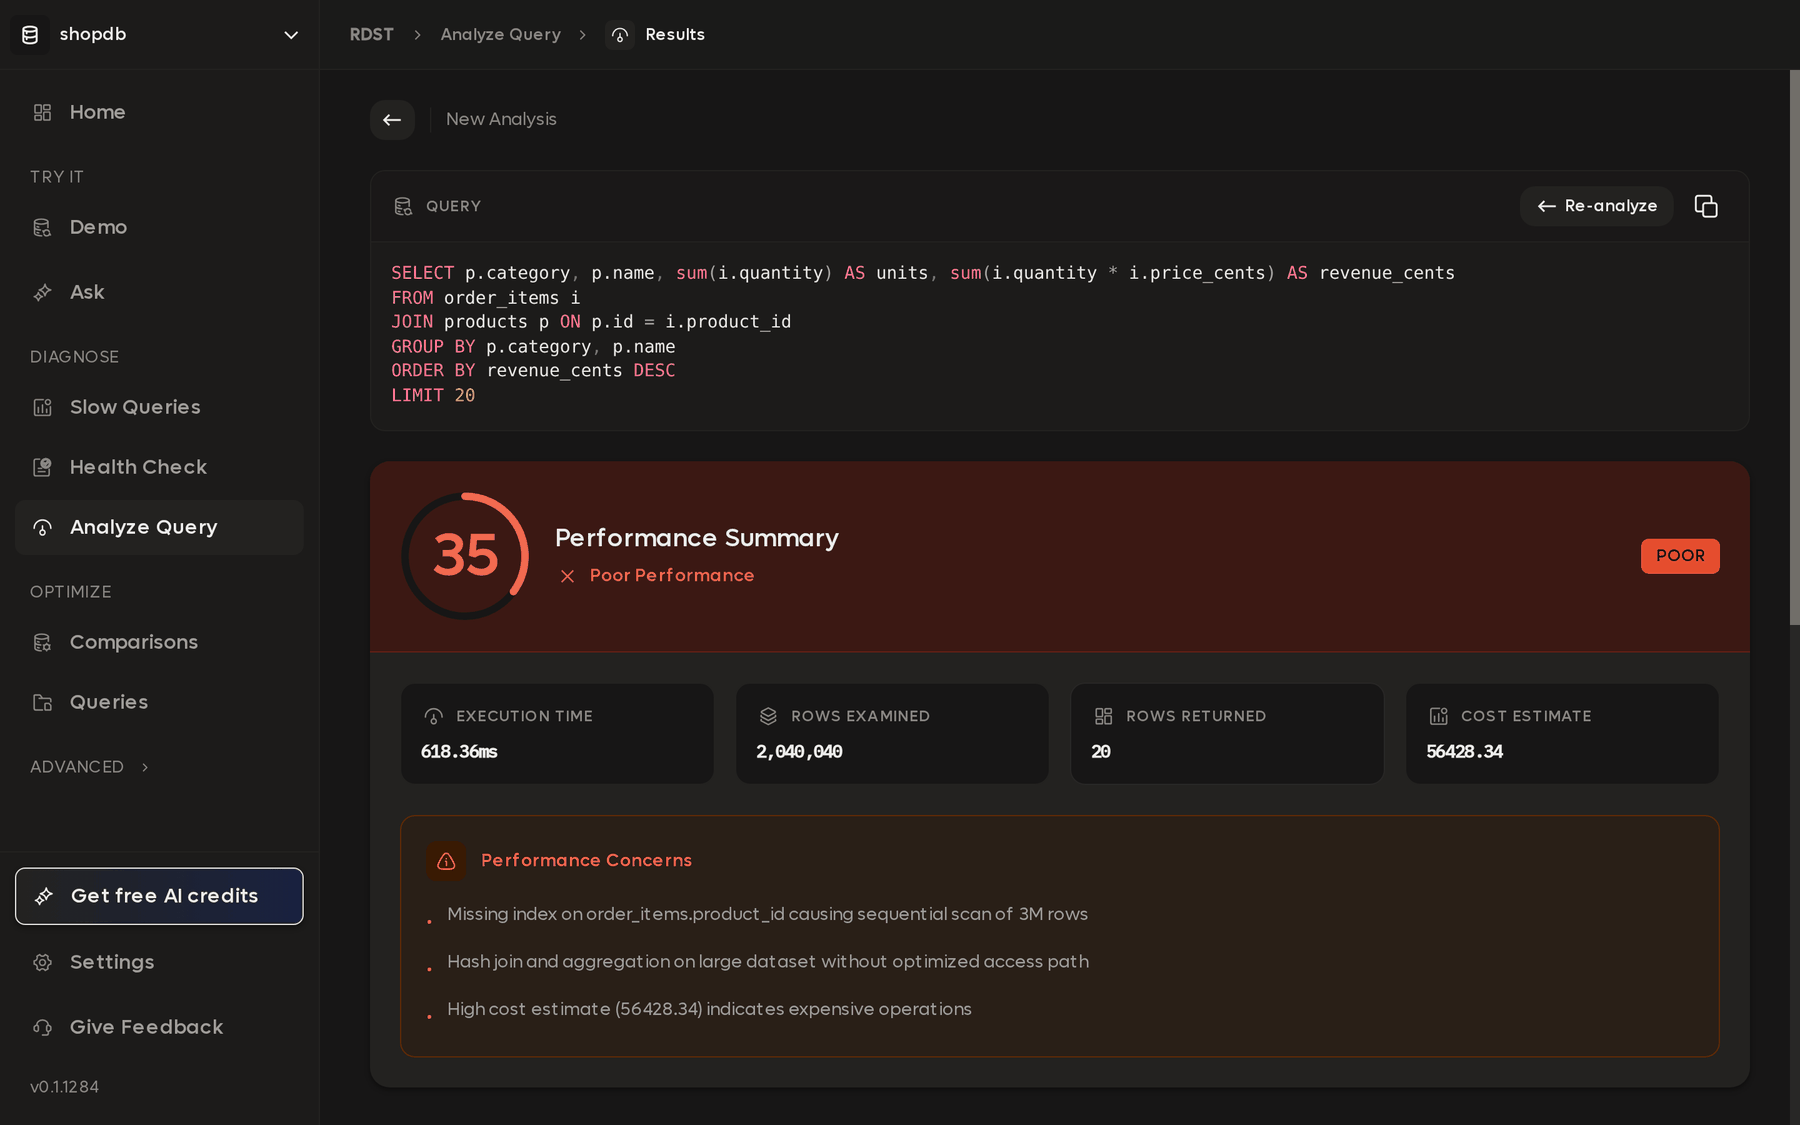
Start with the four numbers along the top. Rows examined next to rows returned usually tells the whole story on its own. Here the database read two million rows to hand back twenty, which is the shape of a query that is scanning a table it should be looking things up in.
Query parameters
RDST uses the original values wherever it still has them, and most of the time you will never see this step.
Queries pulled from historical statistics are the exception. Databases group
every execution of the same query together and throw the literal values away, so
what comes back is a shape with placeholders like $1 and nothing to run it
with. RDST asks you for those values.
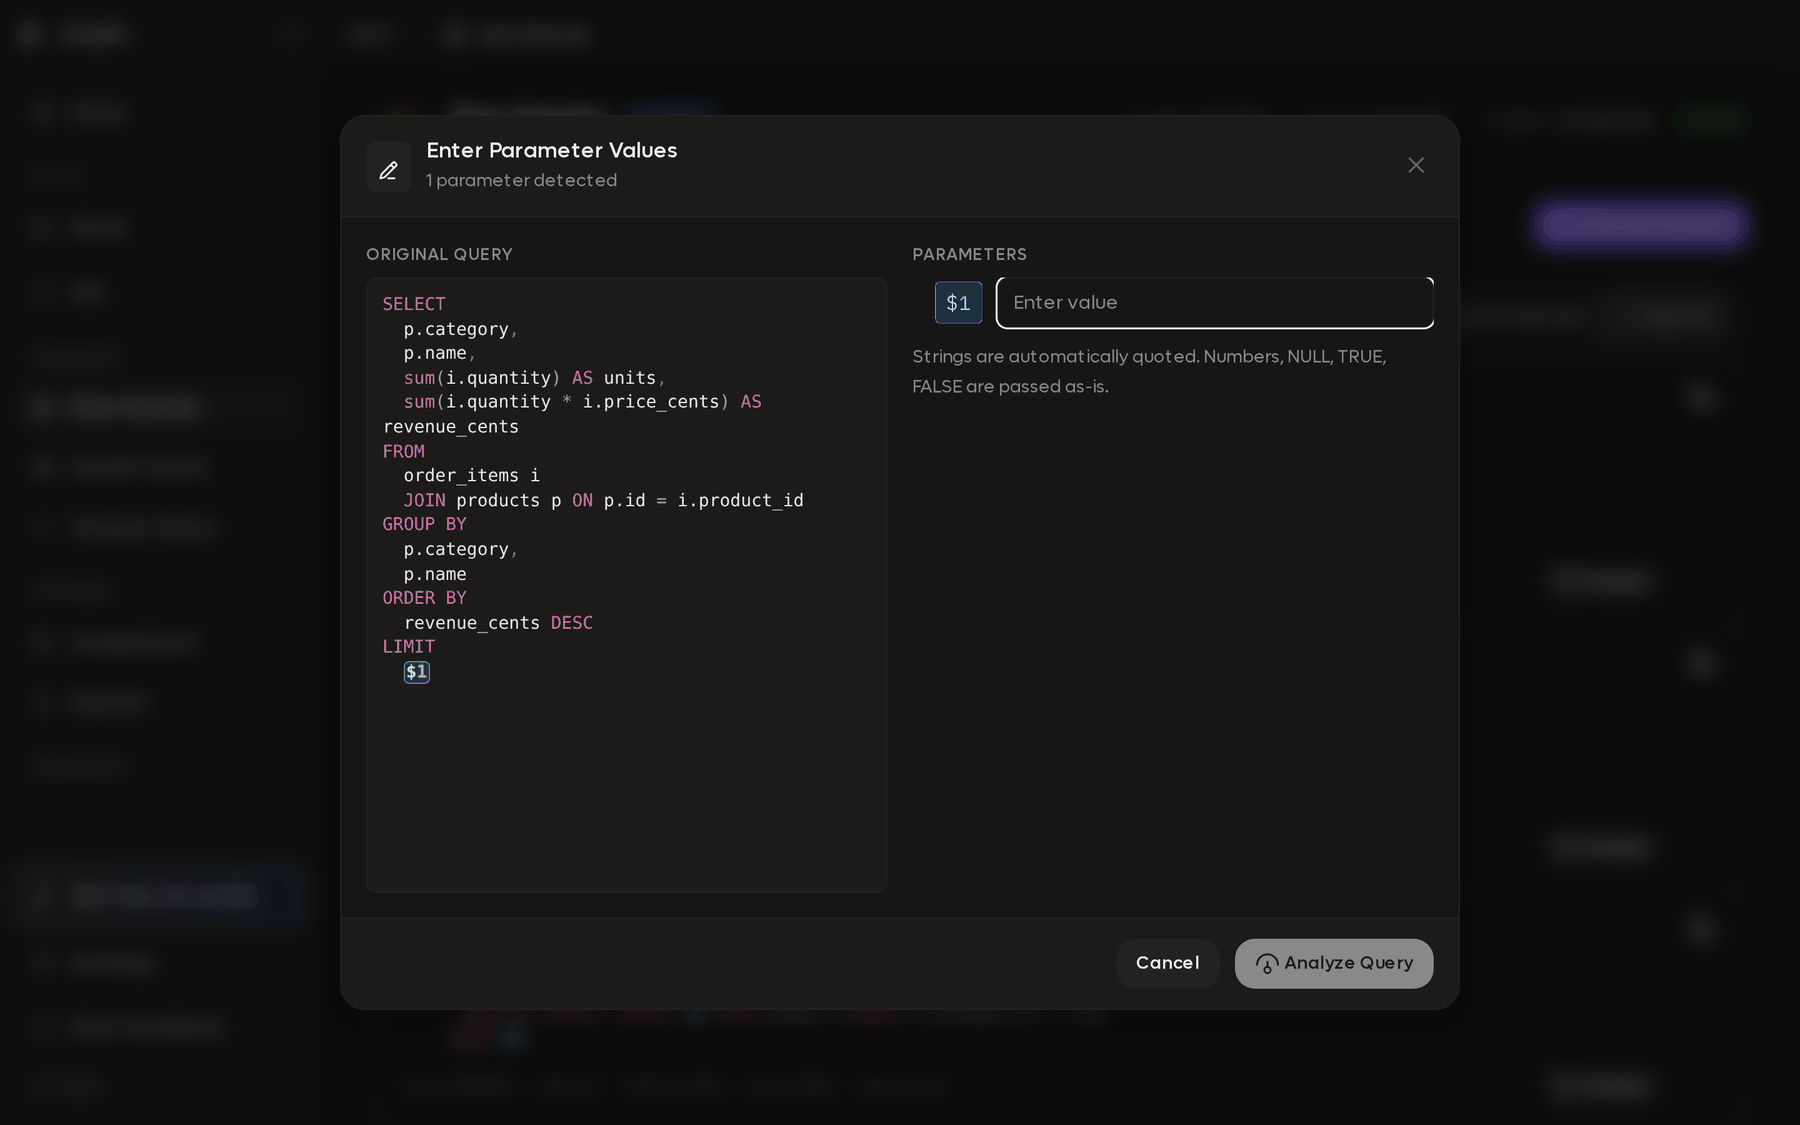
Use values your application would really send. This matters more than it
sounds. WHERE country = 'LU' might match four rows and WHERE country = 'US'
two million, and the database picks a different plan for each. Feed it an
unrepresentative value and the whole analysis describes a query nobody runs.
Strings are quoted for you. Numbers, NULL, TRUE, and FALSE are passed
through as written.
What the analysis covers
RDST runs EXPLAIN for the planner's intent and EXPLAIN ANALYZE for what
actually happened, then reads both.
| Section | What it tells you |
|---|---|
| Execution plan | What the database did, with the expensive nodes called out |
| Estimates versus reality | Where the planner's row estimates were wrong, which is usually the root cause |
| Indexes | Indexes that would change the plan, with the statement to create them |
| Rewrites | Reformulations that produce the same result more cheaply |
| Readyset assessment | Whether this query is a good caching candidate, and why |
The gap between estimated and actual rows is the thing to look at first. A planner expecting 10 rows and finding 400,000 will pick a nested loop that never finishes, and the fix is often stale statistics rather than a missing index.
EXPLAIN ANALYZE executes the query, so RDST asks before running it.
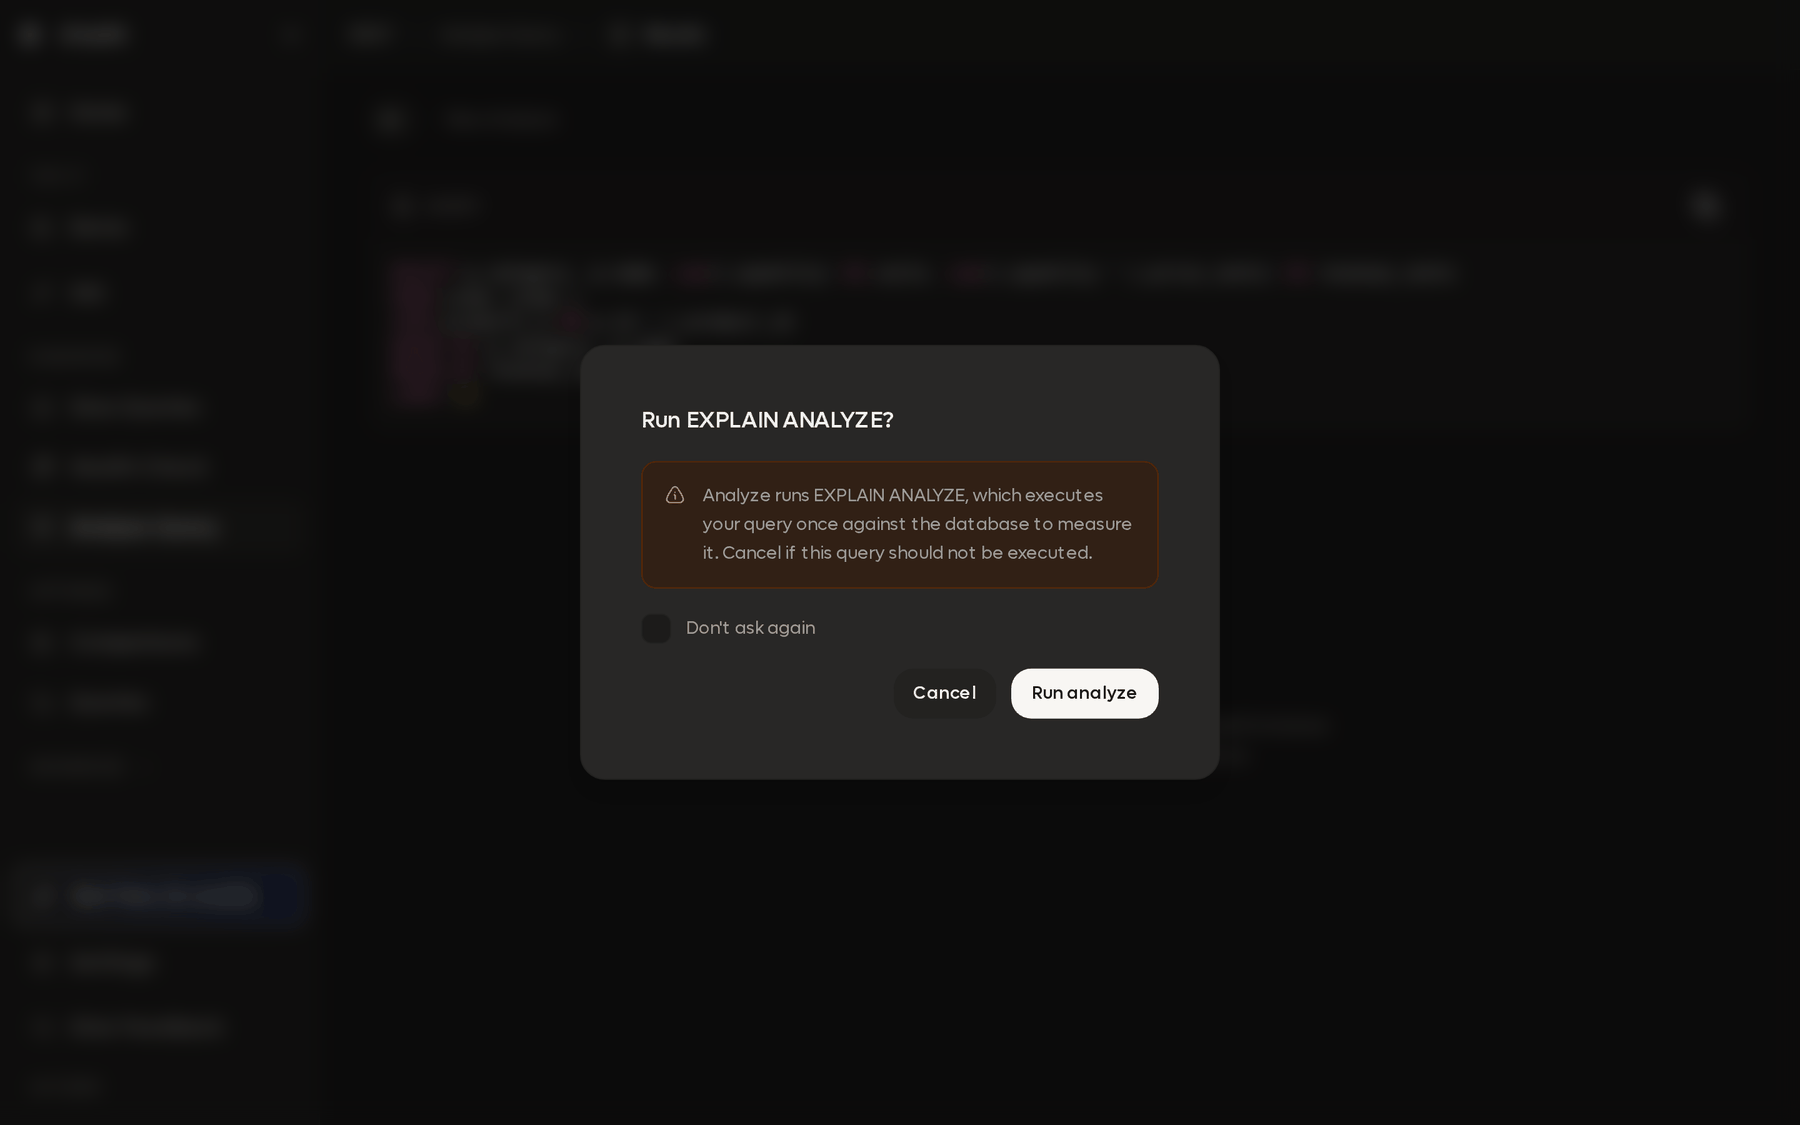
RDST only runs this for read-only statements, so nothing is modified, but a
genuinely expensive query is genuinely expensive to analyze. Cancel if the query
should not execute right now, and you still get the plan from EXPLAIN alone.
Don't ask again turns the prompt off once you are comfortable.
Follow-up questions
After the report there is a conversation pane. It has the plan, the schema, and
the analysis already in context, so you can ask why it recommended a particular
index, what happens if you order the columns differently, or whether the rewrite
changes the result for NULLs.
Slow Queries
Rank every query on the database by how much time it consumes, then send the worst one straight into analysis.
Health Check
Produce a full report on a database: sizing, configuration, indexes, the queries costing you the most, and what to do about them. Run it against one database or several at once.