Less Work per Query: Speeding Up Readyset’s Text Protocol
We made Readyset’s ad-hoc queries faster by doing less work for each query, and this post walks through some of those improvements and how we found them.
Modern applications demand instant performance, even under unpredictable load. Readyset helps you eliminate slow queries, stabilize latency, and scale confidently.
Revolutionize your database performance with Readyset
Serve requests at sub-millisecond latencies with the modern database scaling and query caching system for MySQL and PostgreSQL.
Readyset is in the business of making your queries faster. If you are trying to improve your application’s performance, or reduce load on your database, one of the first things people will tell you is to use prepared statements. What if you can’t? Readyset’s latest release improves performance for ad hoc queries, and this post talks about some of the optimizations we made.
Prepared statements (sometimes "binary protocol”) are faster than ad hoc statements (sometimes "text protocol”) for a simple reason: they avoid repeating work. Instead of parsing, planning, and optimizing a query every time it executes, you do that work once in a PREPARE step. You get a handle to the prepared statement, and can EXECUTE it as many times as you want. You pay once for (most of) the work that is common to every statement execution, and each execution (mostly) only pays for the part that matters: actually getting the data.
Usually, by the time a customer comes to Readyset looking to soothe their database pains, they are already using prepared statements. The problem is, they require application changes. Many customers are trying to improve performance or reduce load on applications that are already legacy, or they don’t have control over (infra teams instead of dev teams), or for some other reason could not be expected to modify queries. That’s why we offer a transparent caching layer in the first place. However, until now, we have not spent much time optimizing our ad hoc statement path. So if one of those customers’ existing applications happened to be using ad hoc statements instead of prepared statements, they should still see Readyset’s signature massive speedup… but it wouldn’t be quite as impressive as the speedup they would get if they were also using prepared statements.
In our latest release, we have done some optimization of the text protocol path. We knew there would be overhead to trim down when each query arrives as SQL text that has to be handled afresh every time. We don't have space to discuss all ~12 significant improvements (depending on how you count), so this post will cover 4 interesting examples. Then, a sequel to this post will describe our new parse cache which is an even bigger jump and brings ad hoc query performance much closer to the prepared statement path.
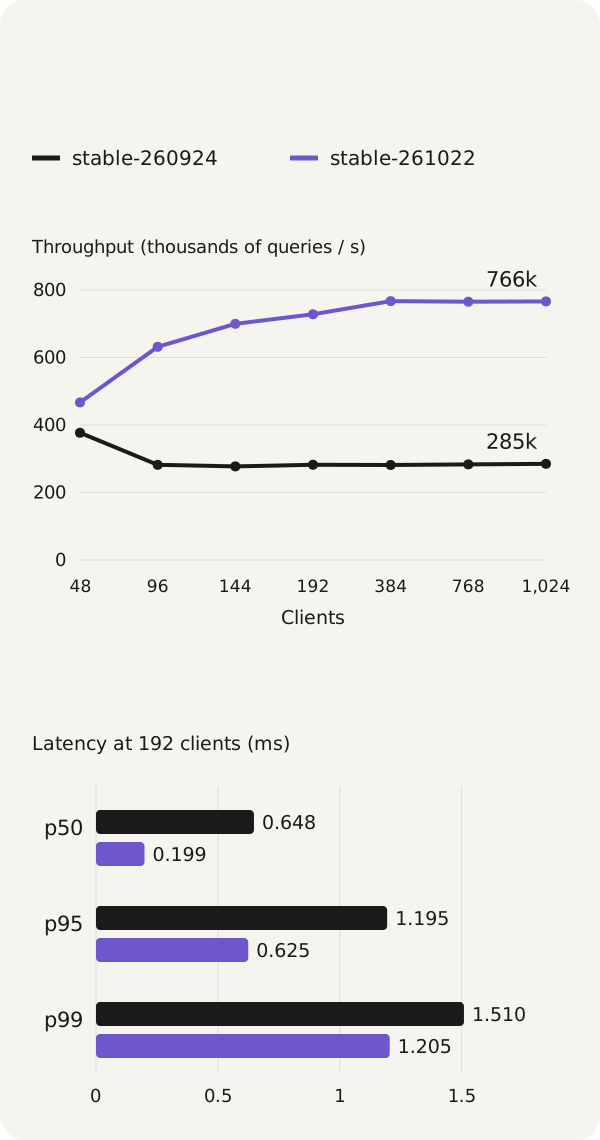
To give you an idea of the scale of improvement just from these ~12 small changes: in a warmed cached point-read test with 1024 clients, this release handled about 2.7 times more throughput than the previous release when using ad hoc statements. That’s our fast case, and we care a lot about making it faster. But that difference only reflects a portion of all the changes. Often, stuff off the happy/hot path can matter just as much. (Have you ever profiled your error paths?) Anyway, let’s get started.
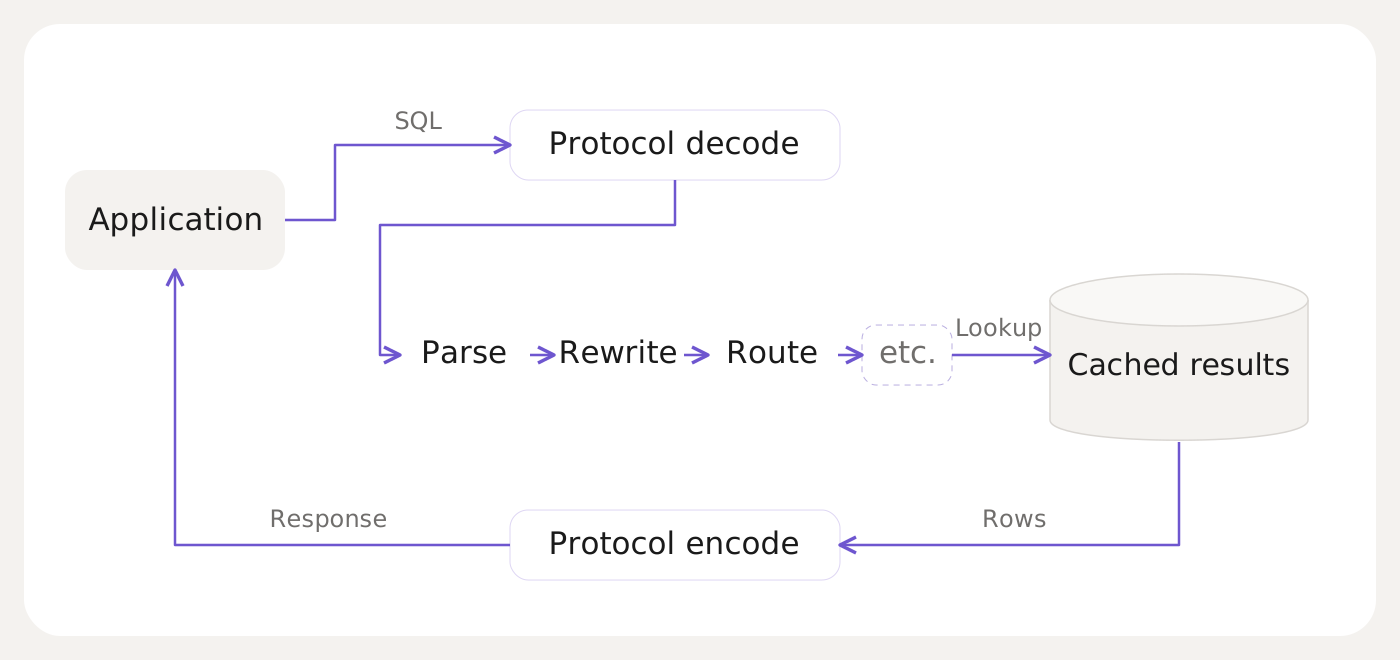
I suppose if you want to understand the improvement we've made to handling queries when they reach the text protocol (or, for that matter, the first time you PREPARE them), we had better understand what the handling process looks like. Once we know which cache to hit and which key to look up, the cached-read path is already pretty well optimized. But getting from SQL text to that cache and key can involve quite a bit of work.
Readyset has two caching modes. Pull-based caching is a TTL-based cache of results retrieved from the upstream database. Push-based caching uses partially-stateful dataflow (Noria OSDI ’18) to maintain query results from database changes only for results you care about based on a CDC stream from the upstream database.
Reading those results starts with finding the corresponding cache, if one exists. This has to respect SQL semantics and things like schema search path/current database. Then we need the cache key: in a prepared statement, the values come from bound parameters, but for an ad hoc query, we have to extract literals from the AST and map them to cache key positions and values. Pull- and push-based caching use similar processes to identify the cache and key, and some parts are shared. (It doesn’t matter much, but technically the following examples assume a push-based cache.)
For example, with a users(id, name, active) table, Readyset needs to auto-parameterize the literal 42:
-- original SQLSELECT*FROM users WHERE id =42;
-- auto-parameterizeSELECT*FROM users WHERE id = ?;
Then it can look up the corresponding cache for that shape, and then look up the value for key 42. If this were a prepared statement, the 42 wouldn’t need to be auto-parameterized.
As you can imagine, there is a lot of complexity hiding in and around those “parse, rewrite, route" boxes in the diagram above. That’s why I very cleverly asked Claude to add an “etc.” box too. Session variables and current DDL state affect how a query is rewritten and what the lookup key should be, some literals should be auto-parameterized and not others, and so on. A more detailed diagram is at the end of this post, but even that mostly only calls out the boxes where we made improvements.
Auto-parameterization isn’t the only SQL AST rewrite pass. Even for this simple query, we need to expand stars and resolve columns:
-- auto-parameterizedSELECT*FROM users WHERE id = ?;
-- normalize: expand stars, resolve columns, etc.SELECT users.id, users.name, users.active
FROM users
WHERE users.id = ?;
This brings us to one of the ~12 improvements (depending on how you count) we made in this release: aren’t some SQL rewrites no-ops for some queries? For example, our support for subqueries in push-based dataflow relies on an “inline derived tables” rewrite. It might look something like this:
-- original SQLSELECT*FROM (SELECT*FROM users WHERE active =true) AS active_users
WHERE active_users.id =42;
-- normalize: inline derived tables, etc. (parameters: 42, true)SELECT users.id, users.name, users.active
FROM users
WHERE users.id = ? AND users.active = ?;
The rewrite passes have to do some fairly nontrivial work: resolve columns to the right table in the right subquery, pick aliases to avoid conflicts, move the inner filter into the outer filter, and so on. For more detail, see how Readyset rewrites SQL.
Our original point query doesn’t have a derived table, so it doesn’t need to do any of that work. In this case, it’s obvious. For some of our rewrite passes, it’s less obvious when it can be safely skipped, so we were applying the rewrites even when they were ultimately no-ops.
This was one of the first things to show up in flamegraphs when we started this optimization effort. But if all we had seen was “rewrites take a good chunk of the CPU cycles for each query”, we might nonetheless have looked elsewhere. However, this was surprising, because this was showing up in flamegraphs with point selects like the first example, too, not just arbitrary query workloads.
Optimization is all about deciding what to measure. This means both the specific observable metrics you collect and compare, whether you are profiling CPU or instrumenting memory allocations, etc.; but also the workload you run. We used a variety, and saw different problems become more prominent in flamegraphs, throughput measurements, lock contention, etc. depending on which workload was running. In this case, point selects generally represent the best case for the "parse, rewrite, route” part of processing a text-protocol query. As a result, looking at a flame graph for a point select with no derived tables and seeing the derived table rewrite taking up a non-negligible amount of time raised our eyebrows, and took us down that path.
Here is what the deep rewrites part of the flamegraph looked like profiling point select queries with and without skipping no-op rewrites, saving about 23% of CPU cycles on rewrites:
SQL rewrite CPU cycles per query. Hover or tap to highlght correlated frames.
Of course, that isn't going to affect queries that do need those rewrites, but most queries will at least skip some rewrites.
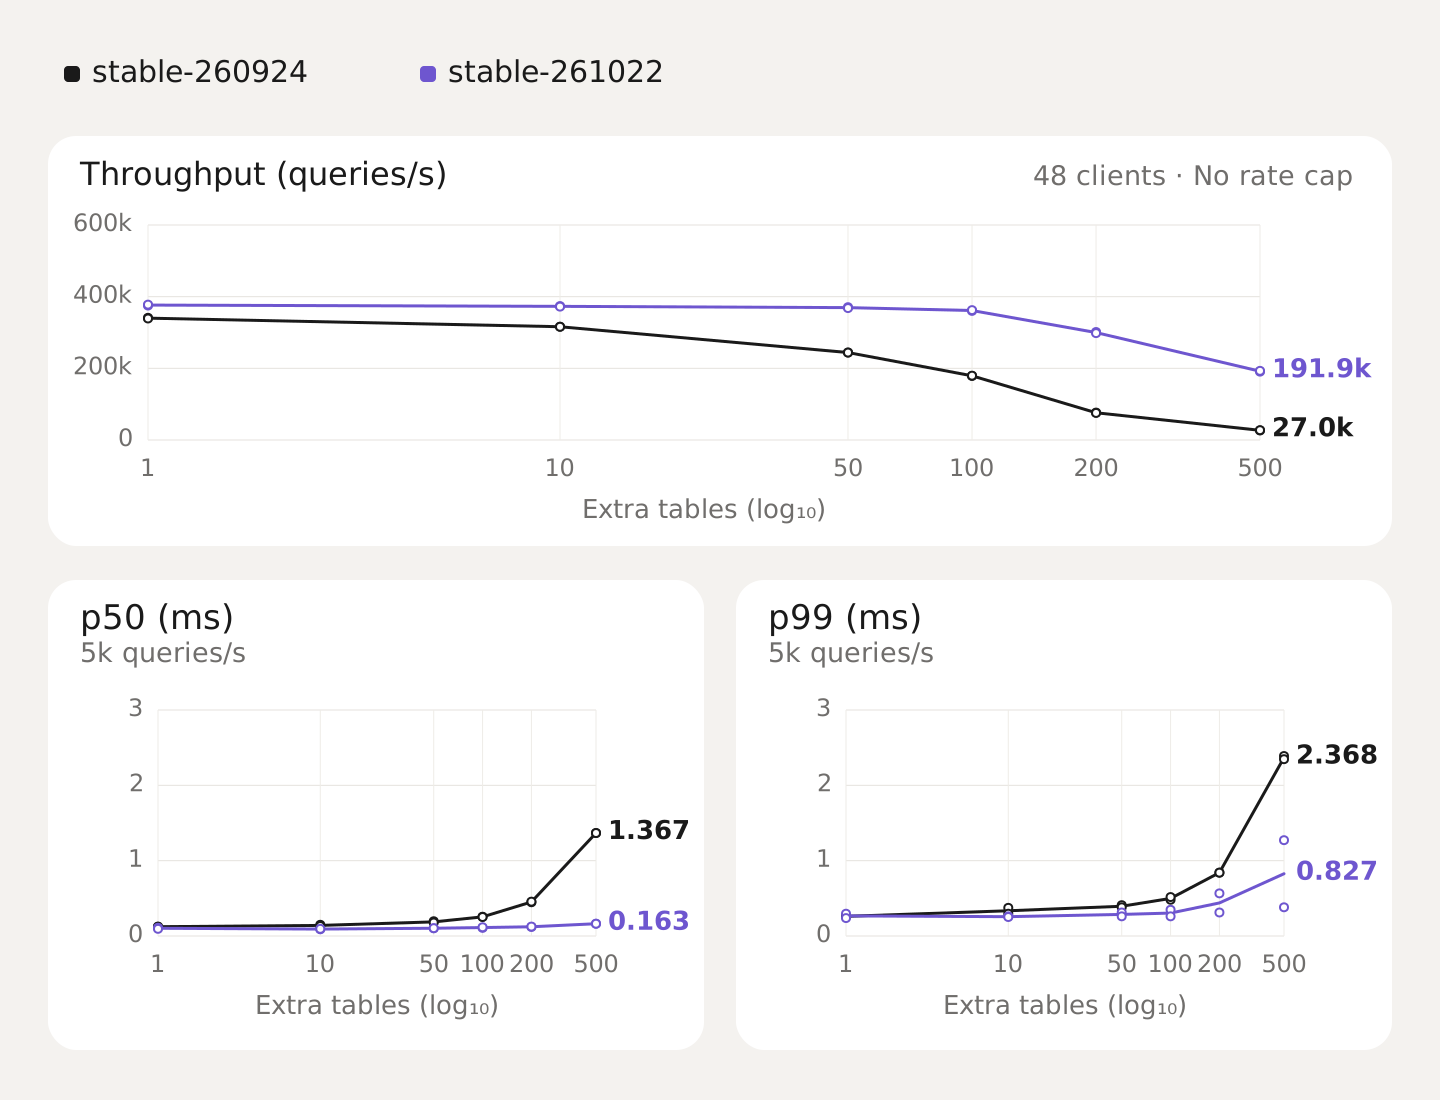
The query itself isn’t the only part of the workload that matters. In a stateful system, state tends to accumulate. Could unrelated state impinge on the handling of a query? What happens if we run the same point select, but add a few hundred tables into the same database that the query doesn’t even reference?
To rewrite a query, Readyset needs information about table schemas. In our example, it needs to know which columns users has to expand SELECT *, and where id comes from. But the work we were doing to make that information available also depended on tables that had nothing to do with the query. Effectively, we were building a hashmap of all relations and all their columns before we started the rewrite passes. A point select against one table was building a hashmap for tens or hundreds of tables. We changed this to look up schema information as the rewrite needs it.
This also meant the larger your database, the wider the gap after it was fixed. With 500 unrelated tables, median latency dropped by 8x at a fixed query rate, and without the rate cap, throughput increased by 7x. Bet Marketing would love it if that were the headline! On the other hand, at 200 tables it’s the difference between 452 µs and 122 µs, and at 10 unrelated tables any difference was lost to run-to-run noise.
Throughput and latency by number of unrelated tables.
After we’ve processed a query, Readyset will store (some might say "cache”) some information about it so we don't have to check again next time we execute it. Is there a cache? Should it go upstream? We store and retrieve that information in the QueryStatusCache. However, when we started measuring throughput under high concurrent load on the text protocol, we discovered we were taking a global write lock to update query status for an existing entry even when it hadn’t changed (and it rarely does). We had never noticed while optimization was focused on the binary protocol, because prepared statements would only take the write lock once at PREPARE time and then reuse the handle.
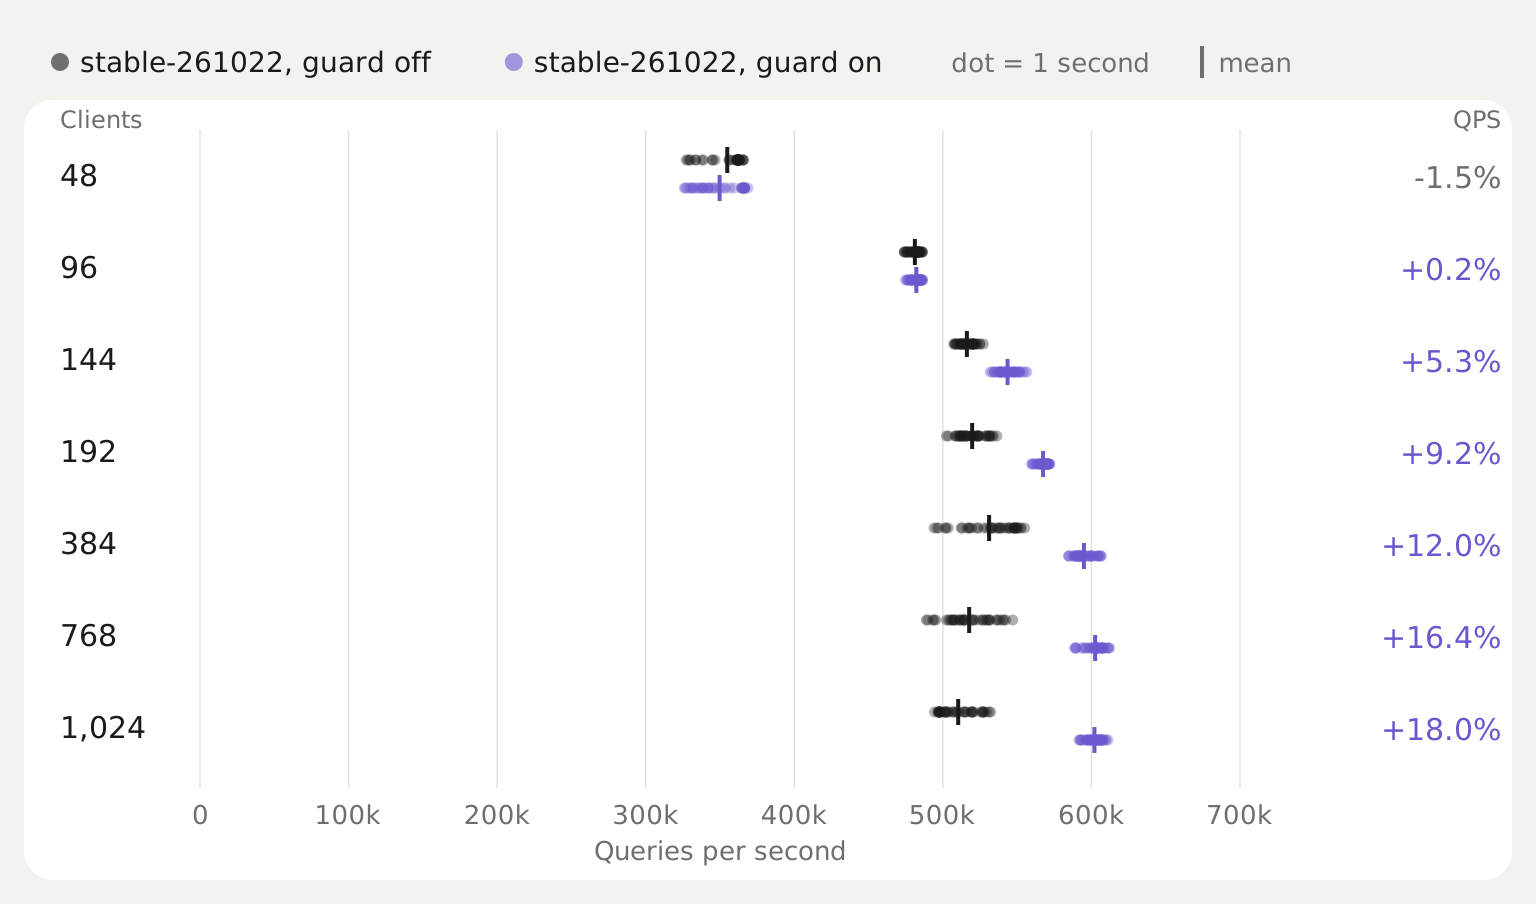
We simply added a condition to an if: check whether there is actually anything to change before taking the global write lock. Lock contention hazards like this often show themselves as a flattening (or worse yet, a cliff) in the throughput curve as concurrency increases, and in one benchmark we saw that starting as low as 96 concurrent clients. But that was with none of the changes in this release.
The previous graph was comparing release-to-release, where you can hopefully still see where specific areas of the product improve. But several different changes removed nonspecific throughput barriers like this one, so I honestly couldn't find a good way to isolate the effect of just this change, other than by hacking in a runtime toggle for that new if condition. That lets the effect of this change be seen more clearly, instead of leaving us at such low throughput that we wouldn't notice much of a difference. So although overall throughput under the same benchmark went up 2.7x from release to release, the portion due to this particular change was only ~18%: throughput at 1,024 clients went from 510k to 602k queries per second, and p99 latency fell from 4.18 to 3.68 ms. The throughput curve was able to go up further in this test, and the fact that without this guard (but with other changes) throughput is already going down from 384 to 768 means that although it was a small change on its own, it was a big part of the overall performance gain in this release.
Text-protocol throughput with the status guard off and on.
By this point we’re hitting the box’s CPU capacity and the curve is flattening out, with both the load generator and Readyset running on it. While I enjoyed measuring the impact of this 1 line diff on a shared box, you probably want to see how far the cached-read path can really go. For that, check out Marcelo’s post with separate load generators and a 10 Gbps NIC. That benchmark uses prepared statements (see the first paragraph of this post), so it’s measuring a different path from the text-protocol work here.
Similar to unrelated tables/queries affecting processing of one query, not all of the work we do for a query is needed to return a result. We also log query information asynchronously, so queries don’t have to wait for the logger. But what happens if queries produce that information faster than the logger can consume it? Seems like it should be unlikely, and we wouldn’t notice if logging is only on PREPARE. Plus... by the time we got to this item, ad hoc queries were a lot faster.
Without a bound on the queue, we could keep accepting queries while accumulating gigabytes of logging work. We bounded the queue, allowing some telemetry to be dropped when the logger falls behind. In an overload test, transient memory use just from the queue went from about 15 GB to 310 MB. Throughput also went up from 1.24 million to 1.35 million queries per second. About 4% of telemetry was dropped in that run. That’s a tradeoff, but life is full of tradeoffs.
These might seem like odd examples for a post about making queries faster. It was mostly just not doing things we didn't need to. In fact, arguably much of these didn’t actually have to do with serving the query but with other tangential parts of the system (though we made plenty of other changes to the hot path too).
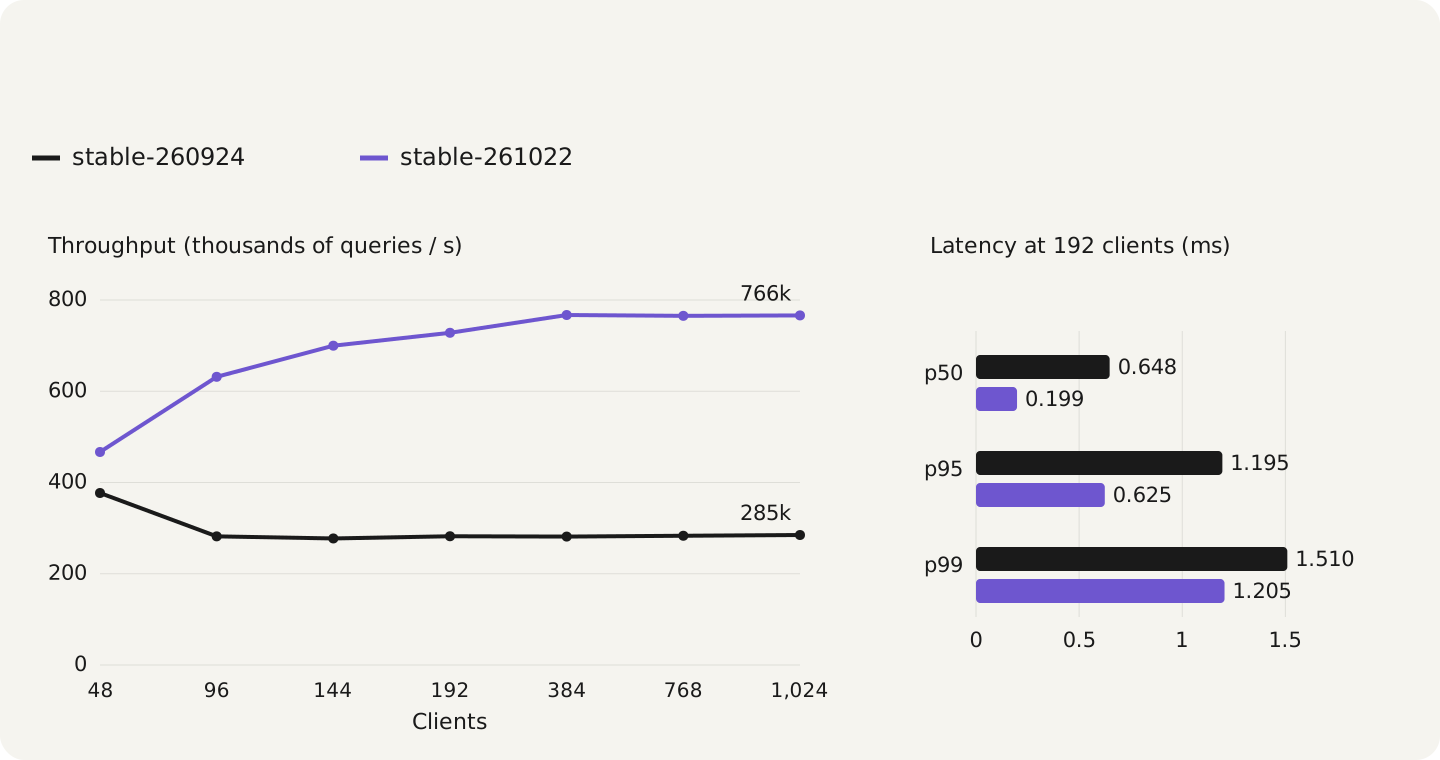
Okay, where did we end up? Well, at the risk of repeating the number 2.7 yet again… 2.7 times higher throughput! Specifically in the warmed cached point-select benchmark which was the worst case for text protocol overhead. At 1,024 clients. At 192 clients, median latency fell by 69%, p95 by 48%, and p99 by 20%. Yeah, I’ve picked these numbers out basically at random, and could have gotten pretty similar numbers from basically every benchmark we ran that didn’t use prepared statements.
Text-protocol throughput by client count; latency at 192 clients.
Well, after harping about not doing stuff for so long, you must be convinced that laziness is indeed a virtue. And in a follow-up post, we’ll go another level deeper: what if we can avoid doing any of the work we just discussed, and make Readyset’s text-protocol performance even closer to the prepared statement path?
In the meantime, here is a more detailed diagram which shows the places we made some other noticeable improvements in this release.
Text-protocol query path. Hover or focus a numbered marker to highlight its component.
Disclaimer: This post’s prose was machine-generated by a 36-key Beekeeb Piantor Pro operated by an artificially intelligent bio-appendage prone to hallucination. The diagrams’ SVG were handwritten by some people named Claude and Astra.



 Marcelo Altmann

 Vassili Zarouba