How We Reached 4.3 Million QPS for MySQL and PostgreSQL workloads on a Single Readyset Node
Readyset now serves 4.3 million queries per second from a single node, more than 6x what we could do on the same hardware before. We got there by profiling the serving path, fixing the bottlenecks we found, and measuring again. The result is not only higher throughput, but lower latency and much better use of the hardware.
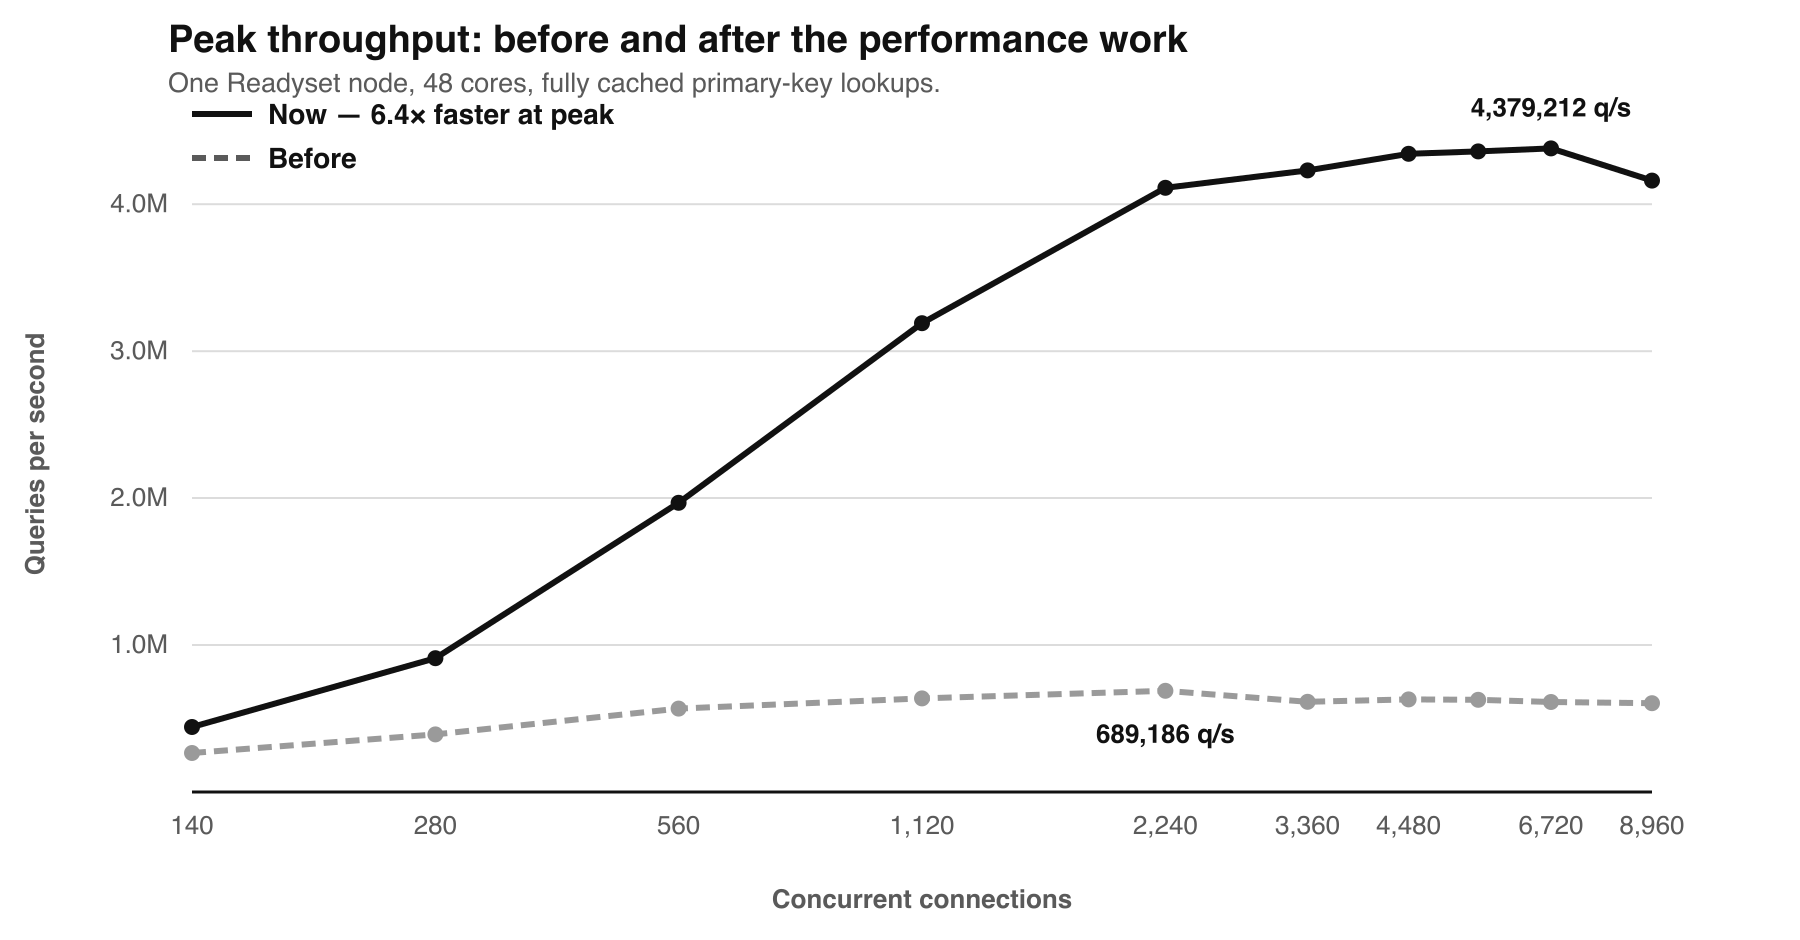
A single Readyset node can now serve 4,379,212 queries per second , more than 250 million queries per minute , while keeping p95 latency at 2.26 ms. That is 6.4x the throughput we measured with the previous release on exactly the same hardware, roughly twice the peak we measured with PostgreSQL, and almost three times what we measured with MySQL on the same server.
These improvements are available now in stable-260827.
How we measured it
One Readyset node running on an AMD EPYC 9454 with 48 cores / 96 threads, 251 GiB of RAM, a Broadcom 10 GbE NIC, and Linux 6.8. Load came from 35 separate machines running sysbench 1.0.20, each with 8 vCPUs, issuing primary-key lookups through server-side prepared statements over the MySQL binary protocol. Every query was a cache hit. We tested ten concurrency levels, from 140 connections up to 8,960, running each for two minutes.
Using 35 load generators was important. In earlier testing a single generator would saturate its own kernel well before Readyset reached its limit, which makes it easy to benchmark the client instead of the server. Spread across 35 machines, the generators were still at around 40% CPU when the Readyset server reached 99%. The 4.3M QPS ceiling belongs to the Readyset machine.
This benchmark covers one thing: how fast a single Readyset node can serve cached reads. The workload is primary-key lookups with a 100% cache-hit ratio and everything needed to answer them already in memory.
Read these numbers as the ceiling for that path, not as what Readyset will do on every workload. Cache misses, writes, replication, complex result sets, and different query patterns exercise different parts of the system and will perform differently.
We isolated the serving path so we could find its limit and raise it. For this workload that limit moved from roughly 690K QPS with most of the CPU idle to 4.38M QPS with the server fully utilized.
What changed
Most of the work in this release came from profiling the serving path, finding the next bottleneck, removing it, and measuring again.
CPU utilization gave us the first clue. The previous version topped out at around 690,000 queries per second with the server using only about 33% of its available CPU. We had 96 adapter threads, each consuming roughly 33–41% of a core, but none could push beyond that. Throughput had already plateaued while roughly 60 cores were still sitting idle.
The bottleneck was in the Tokio async runtime. All connections shared a single I/O driver, so readiness events had to flow through the same driver thread and an exclusive lock. With thousands of connections issuing small reads, that driver thread reached its limit while most of the machine still had CPU capacity available.
Readyset now distributes connections across multiple runtimes, assigning each new connection to the runtime with the fewest active connections. That removed the largest bottleneck and let Readyset use the rest of the CPU.
Once we could do that, several costs that had been hidden started to matter, and we worked through those as well:
- Replaced SipHash with ahash on the reader map, shared view caches, and the failed-view set.
- Replaced a HashMap with a SmallVec when building key comparisons, since it normally contains only a couple of entries.
- Memoized query IDs for shallow-cache requests instead of calculating them again for every query.
- Removed the per-query wakeup from the query logger.
- Stopped writing connection status on cache hits.
- Fixed a buffer-pool lookup and removed an unnecessary sort during flush in the MySQL protocol implementation.
- Moved a per-connection tracing span to DEBUG.
- Skipped per-query event bookkeeping when nothing is consuming those events, which alone improved peak throughput by about 11%.
This was not the result of one big change. We kept profiling, fixing the next bottleneck, and measuring again. By the end, Readyset was serving 4,379,212 queries per second while fully utilizing the machine, with CPU cost per query down from 45.7 µs to 21.7 µs.
Latency got better too
Throughput improved and latency improved with it. At 2,240 connections the previous release served 689,186 queries per second with a p95 of 5.18 ms; the new release serves 4,111,367 at the same concurrency with a p95 of 0.75 ms. That is 6.0x more throughput with p95 latency almost 7x lower.
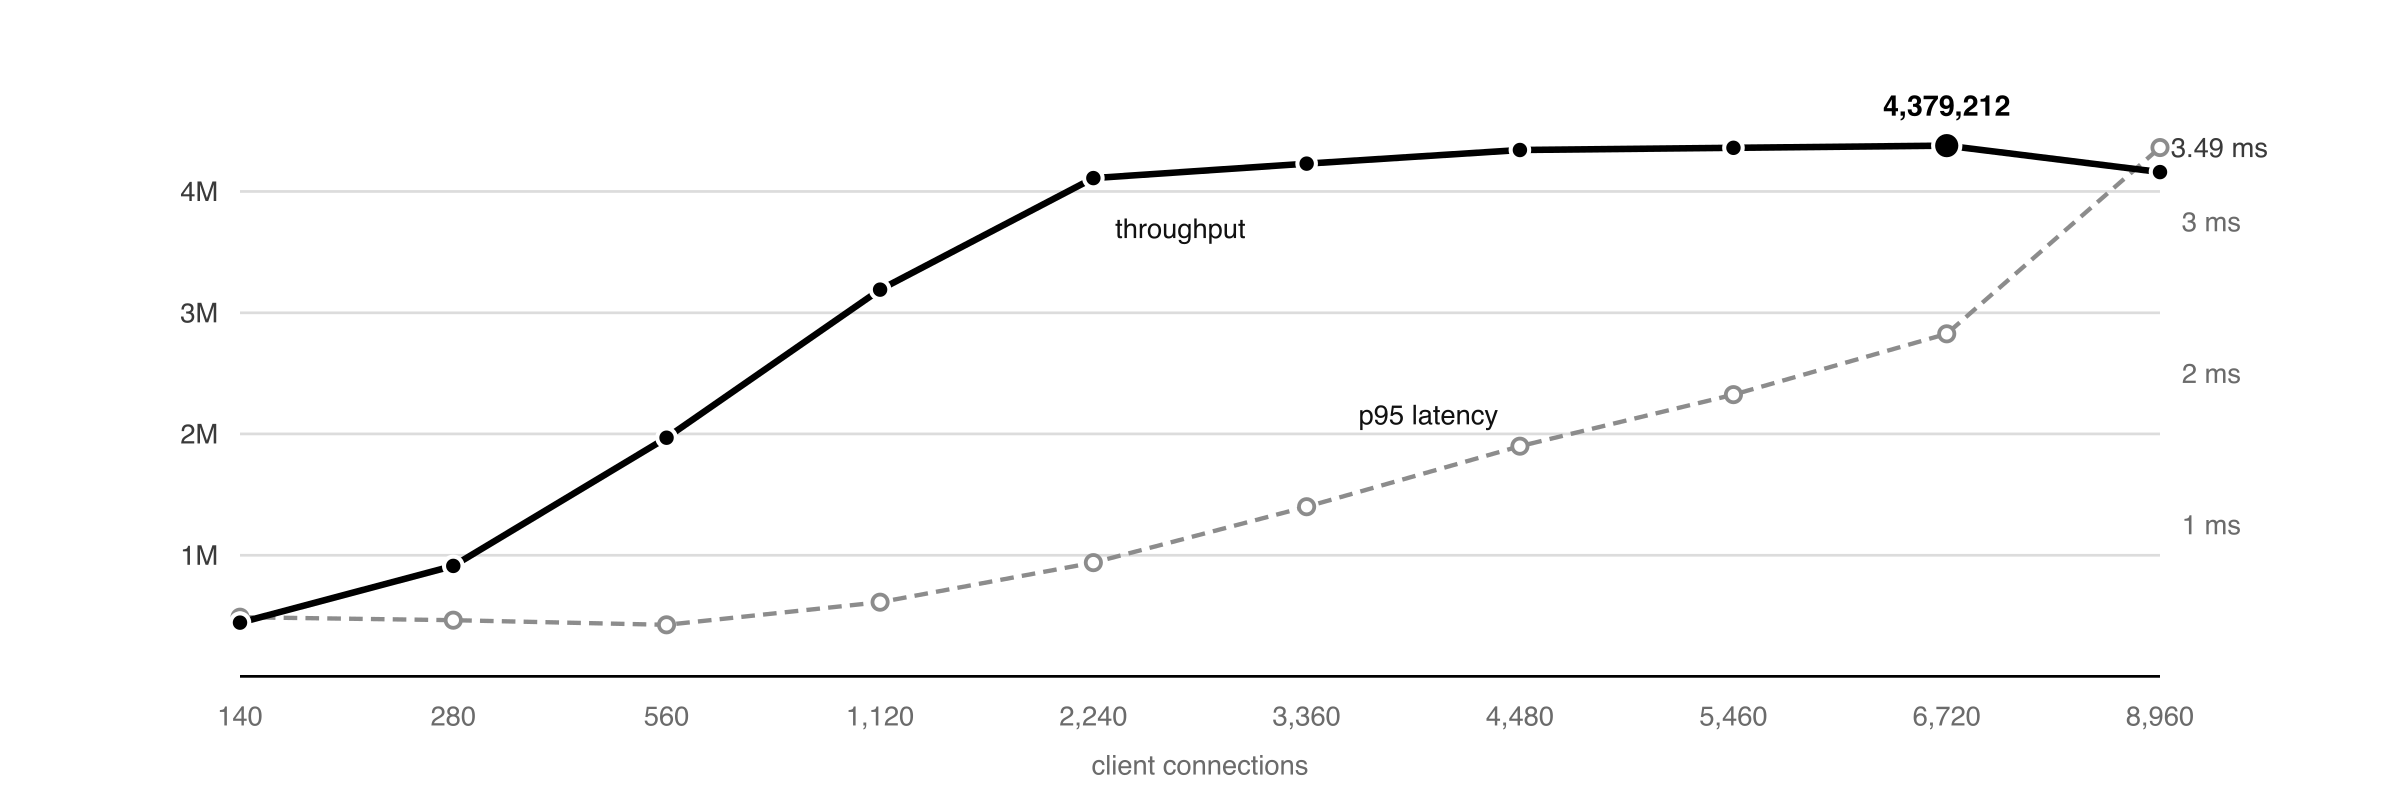
The same pattern shows up throughout the test:
| Connections | Before | Now | Gain | p95 before | p95 now |
|---|---|---|---|---|---|
| 140 | 265,215 | 442,895 | 1.7x | 0.65 ms | 0.39 ms |
| 280 | 392,164 | 910,743 | 2.3x | 0.99 ms | 0.37 ms |
| 560 | 567,176 | 1,967,790 | 3.5x | 1.42 ms | 0.34 ms |
| 1,120 | 636,771 | 3,189,412 | 5.0x | 2.81 ms | 0.49 ms |
| 2,240 | 689,186 | 4,111,367 | 6.0x | 5.18 ms | 0.75 ms |
| 3,360 | 613,721 | 4,229,955 | 6.9x | 7.43 ms | 1.12 ms |
| 4,480 | 630,420 | 4,343,263 | 6.9x | 9.22 ms | 1.52 ms |
| 5,460 | 627,597 | 4,359,420 | 6.9x | 10.84 ms | 1.86 ms |
| 6,720 | 611,894 | 4,379,212 | 7.2x | 13.22 ms | 2.26 ms |
| 8,960 | 603,688 | 4,160,357 | 6.9x | 17.01 ms | 3.49 ms |
Looking back at the old results, the bottleneck is easy to see. Adding more connections did not increase throughput; it just increased the time they spent waiting on the same shared resource, pushing tail latency higher. Once we removed that contention, Readyset stayed below 1 ms p95 through 2,240 connections. Even at 8,960 connections, it still served more than 4.1 million queries per second with a p95 of 3.49 ms.
Your database can't do this
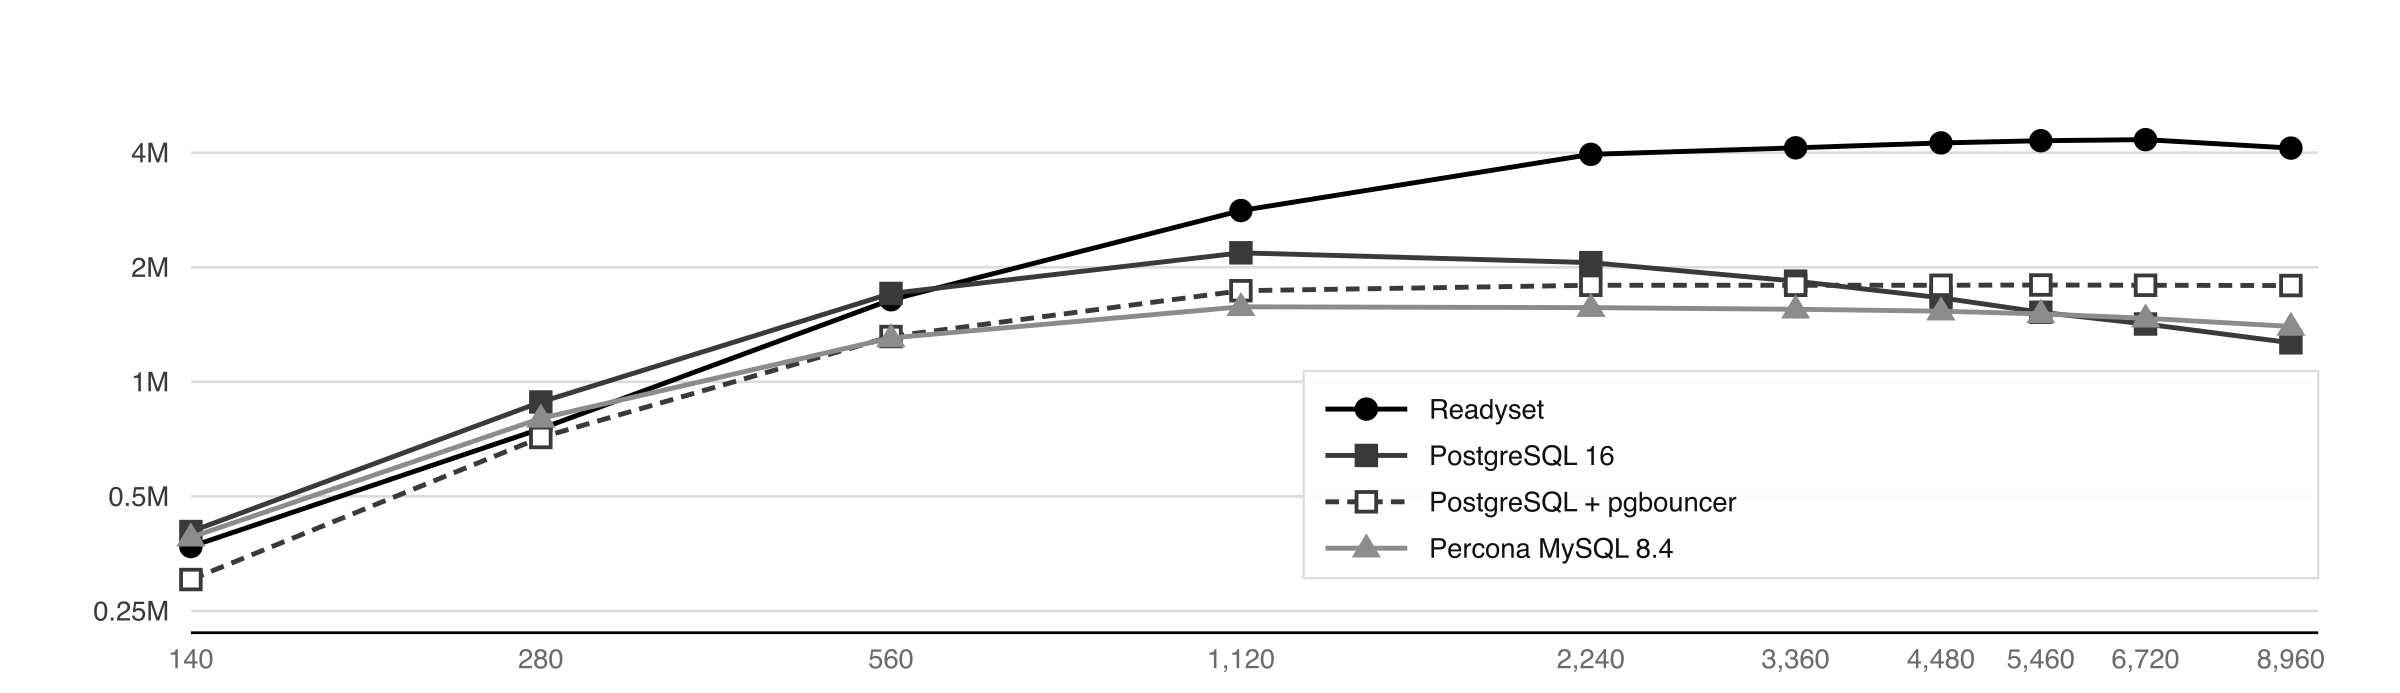
We ran the same workload directly against PostgreSQL 16 and Percona MySQL 8.4 on the same server. Both databases peaked at 1,120 connections, and adding concurrency past that reduced throughput.
| Peak throughput | Peaks at | Server CPU | CPU per query | |
|---|---|---|---|---|
| Readyset | 4,379,212 q/s | 6,720 conns | 99.1% | 21.7 µs |
| PostgreSQL 16 | 2,181,981 q/s | 1,120 conns | 97.6% | 42.9 µs |
| PostgreSQL + pgbouncer | 1,797,759 q/s | 5,460 conns | 98.9% | 52.8 µs |
| Percona MySQL 8.4 | 1,573,565 q/s | 1,120 conns | 98.5% | 60.1 µs |
There is an architectural difference behind these numbers. PostgreSQL and MySQL still have to take each query through the database execution path. Even for a simple lookup with the data already in memory, that means prepared-statement execution, transaction handling, the execution engine, concurrency control, and finally returning the result.
A Readyset cache hit has a much shorter path. The query is already cached, so Readyset identifies the cached query, looks up the requested key, and sends the result back over the database protocol.
That difference shows up as concurrency increases. PostgreSQL’s userspace CPU cost per query rises by roughly 70% as more connections are added, eventually reaching the point where additional concurrency reduces throughput. Readyset does much less work for each cached read, allowing it to continue scaling until the server runs out of CPU.
We tested pgbouncer as well, and it does what a connection pooler should: it makes PostgreSQL much more stable as client concurrency grows. With pgbouncer, PostgreSQL sees roughly 1,050 connections regardless of how many the clients create, so throughput stays almost unchanged across several increases in client concurrency. What pooling changes is stability rather than capacity , it settles PostgreSQL at around 1.8M QPS, against Readyset's 4.38M.
There is another important difference: Readyset sits on the same database protocol as MySQL and PostgreSQL. For this benchmark, we did not need a Readyset-specific client or a different workload. We ran the exact same sysbench benchmark against the database and Readyset; the only change was the connection endpoint. That gives us a direct apples-to-apples comparison: same client, same queries, same prepared statements, same protocol.
The same applies to an application. Unlike a traditional cache that requires adding cache lookups and cache-specific logic to the application, Readyset stays on the database path. Point the application at Readyset, choose which queries to cache, and the application continues using the database protocol it already speaks.
Where the CPU goes now
After reaching the new ceiling, we profiled the server again. At saturation, 56.3% of CPU cycles are spent in the kernel networking stack, compared with 42.8% across all Readyset userspace code. The cache read path itself , finding the reader, hashing the key, and performing the lookup , accounts for only about 7% of total cycles.
The MySQL protocol is half-duplex: the client sends a query, waits for the response, then sends the next query. For this workload, that means at least one packet in and one packet out per query. At 4.3 million QPS, the server is handling roughly 8.7 million packets per second.
At this scale, most of the CPU is no longer going into the cache lookup. It is going into getting packets through the kernel. With the lookup path accounting for only about 7% of total cycles, further optimizing it has limited room to improve throughput. The network stack is now the limiting factor.
The full benchmark
More data sits behind these results than fits in a blog post. The full paper includes the complete methodology, results from all ten concurrency levels across Readyset, PostgreSQL, PostgreSQL + pgbouncer, and MySQL, and the profiling data we used to understand where the remaining CPU cycles go.
Measuring the Maximum Query Throughput of a Single Readyset Node (PDF)
Get more out of the hardware you already have
Compute is becoming more expensive. AI workloads are competing for the same CPUs, memory, networking, and data-center capacity that databases depend on. In that environment, scaling by adding more database servers becomes an increasingly expensive answer.
The alternative is to get more useful work out of the hardware already running. Repeated reads consume database CPU even when the data is already in memory and the query is simple. Moving that work to Readyset leaves the database CPU available for writes, cache misses, and queries that actually need the database execution engine.
That is where efficiency starts to matter as much as raw performance. With this release, a single Readyset node can serve more than 4.3 million cached queries per second.
Download Readyset and see what it can do with your workload.
More customer stories

Hussle Technology Trusts Readyset QueryPilot to Handle Peak-Season MySQL Load
About the Customer: Hussle Technology Hussle Technology is a global leader in direct sales and field-sales enablement software, empowering brands and their distributed seller networks with tools to sell smarter, faster, and at scale. The platform centralizes content management, learning and onboarding, AI-driven task automation, live selling, real-time analytics, and engagement tools into a single configurable system designed specifically for direct selling and affiliate organizations. Hussle

Grupo Ótima Digital Trusts Readyset to Scale Growing MySQL Infrastructure
Brazil’s leading provider of messaging solutions, Group Ótima Digital, seamlessly integrates Readyset’s database scaling platform to scale their existing MySQL infrastructure with ZERO code changes

How ClickFunnels Overcame Database Scaling Challenges and Optimized MySQL Queries with Readyset
ClickFunnels leverages Readyset’s database scaling and query caching solution to boost performance and cut AWS Aurora MySQL costs.