Readyset Weekly: Issue 78
Why Your Query Stats Can’t Tell You When Something Broke
When a query gets slow, your customer will often notice before you do. The page drags, someone pings on-call, and an engineer opens pg_stat_statements or performance_schema to work out what changed. By then the query has often been getting worse for days, and the numbers showing it were sitting in the database the whole time. The problem isn't that the data is missing. It's that the data can't tell you when.
Here's what those tables actually store. pg_stat_statements on Postgres and events_statements_summary_by_digest on MySQL keep running totals for each query since the last reset: how many times it ran, how long it took in total, and an average. That average is the problem. Say a query ran 500,000 times at 6 ms over three months, then ran at 184 ms all day yesterday. The table still shows an average of about 8 ms. The slowdown is in there, but months of fast runs bury it. The max column doesn't rescue you either. It tells you a slow run happened at some point, not when, or whether it's still happening.
What a running total hides:
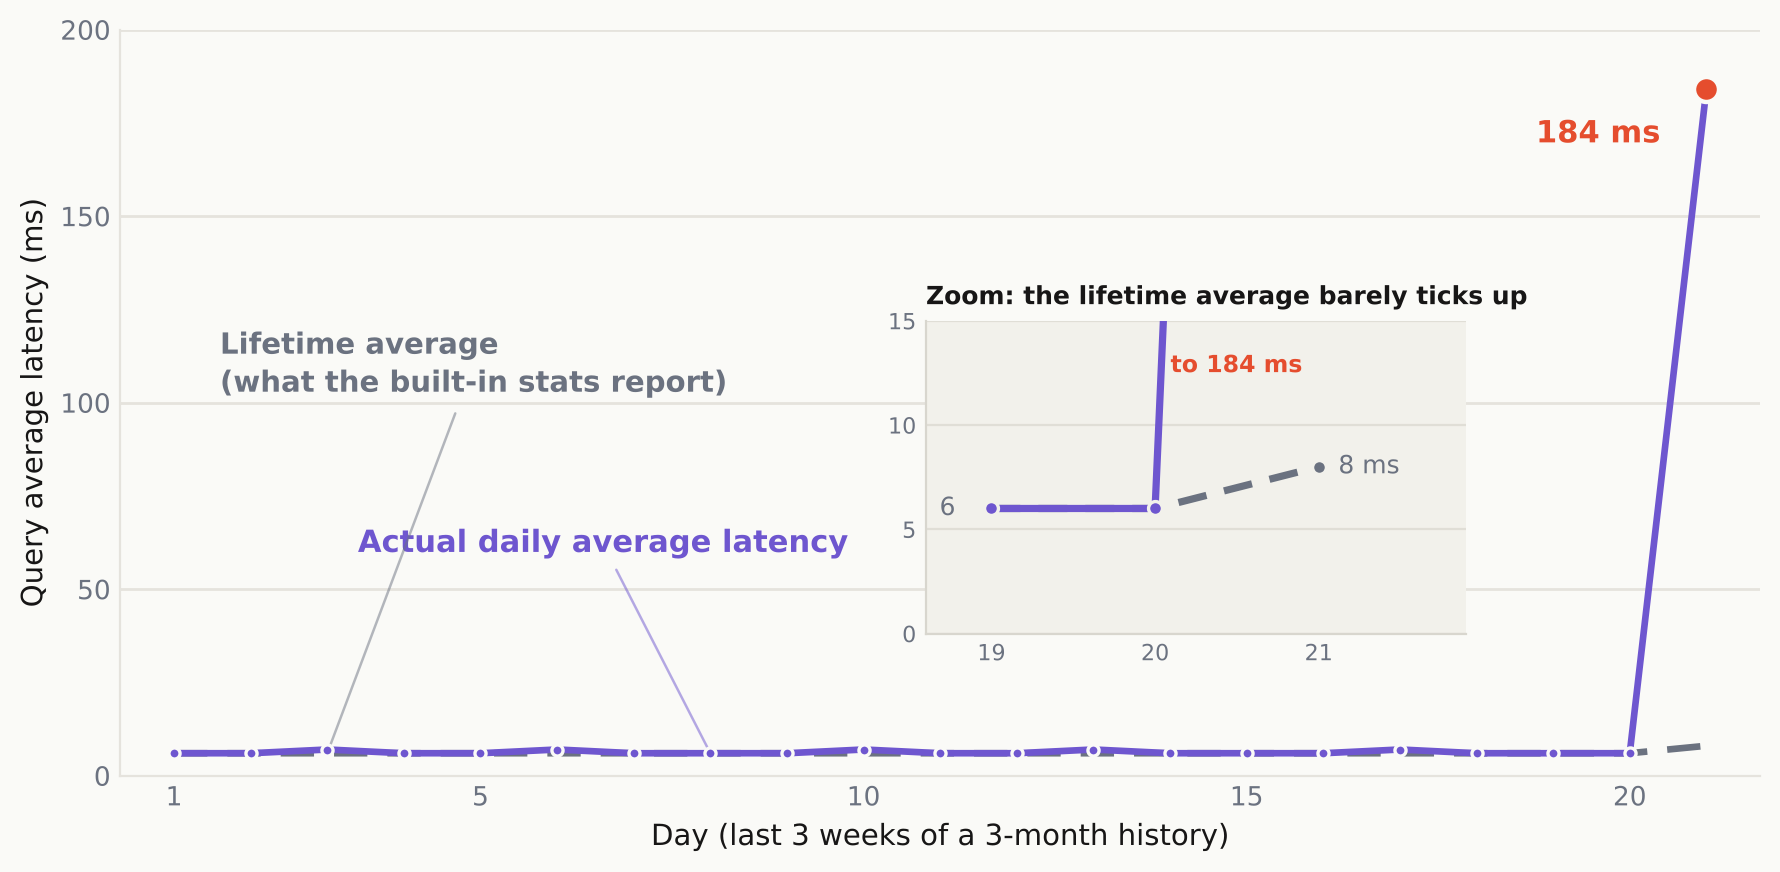
You can work around this by snapshotting the counters on a schedule and diffing them to rebuild a timeline, and plenty of teams start down that road. It quickly becomes its own project: a job that runs every minute, somewhere to keep the snapshots, logic to compare each query against its own past, alerts for when it drifts, and someone to maintain all of it. Even with that in place, the raw tables work against you in two more ways.
Capacity is the first. Postgres tracks 5,000 distinct queries by default and drops the least-executed ones once full, which are the rare statements, including the occasional slow query you'd most want to catch. MySQL keeps counting past its limit, but folds every new query shape past the limit into a single anonymous row, so you see the traffic but not which statement it was. Then there's the reset: a manual reset, a MySQL restart, or a Postgres crash or failover zeroes everything, wiping the baseline right when you need it, like after a deploy.
So the built-in stats answer one question well: which queries cost the most, all-time. What on-call actually needs is narrower and time-shaped: did this query change, when, and compared to what. Teams with a DBA or a monitoring budget usually have tooling that answers that. Plenty of teams running Postgres or MySQL on RDS, Supabase, Neon or their own servers don't, so performance tends to get checked only after something breaks.
Our newly launched RDST Agent keeps the history these tables throw away. It reads your database's query stats every minute and stores a record of each query, so the averaging, the eviction, and the resets don't erase it. Instead of one lifetime mean it keeps a day-by-day picture, compares each busy query against its own past every five minutes, and flags the ones that slowed down, got busier, or changed plans, then gives you the fix. It reads only, never writes, and it's free and open source.
🔍 What We're Watching in the Database Ecosystem
Five PostgreSQL queries that did more work than I asked for
Five small differences, each timed against its alternative on the same two-million-row table. UNION where UNION ALL would do took 13.6 seconds against 0.68, because Postgres has to deduplicate two million values before it can count them. A MATERIALIZED CTE went from 0.24ms to 1,973ms by blocking the filter from reaching the primary key index. Hollis Varden publishes the script and the raw numbers, and lists what he didn't test.
MySQL Online DDL "Duplicate Key" Optimization
Rebuilding a table with Online DDL can fail near the end with a Duplicate Entry error when the table holds no actual duplicates. Libing Song traces it through the row log and MVCC: a concurrent write that itself failed on a duplicate key still leaves an insert and a compensating delete behind, and replaying that insert during the final apply takes the whole DDL down with it. He then shows how AliSQL avoids it by safely ignoring those false duplicates, a fix stock MySQL doesn't have.
Shaun Thomas explains why clearing out pg_wal to free disk space can break your backups, using a bank ledger as the comparison: the data files are the printed balance, and the WAL is the line-by-line record it was derived from. Written for the developer who inherited Postgres without asking for it.
In Case You Missed It
New on our blog:
What Is the N+1 Query Problem? How to Detect and Fix It: An agent generating a model, view and template in one pass will reproduce the loop-and-access pattern it saw in the tutorials, and the person reviewing the diff is checking whether it works. How to find N+1 queries in Postgres and MySQL once they're already in the codebase.
We're getting more social, catch the latest on Bluesky, X, dev.to, and Medium too.
Know a database aficionado who'd appreciate this? Forward it their way.
Get Readyset Weekly in your inbox
One email a week — what shipped, what we learned, and what is worth reading.