← Back to blogTutorials
Monitor Readyset with Percona PMM
Readyset takes reads off your database, and PMM is a good place to watch what it serves. This walkthrough adds Readyset to Percona PMM as an external service and imports its Grafana dashboards, so cache hits, misses, refreshes, and replication show up alongside the load that still reaches the database. Tested with Readyset 1.32.0, MySQL 8.4.13, and PostgreSQL 16.15.
Vinicius Grippa
2026-11-17 · 4 min read
When an application starts reading through Readyset, the database sees fewer requests for cached queries. That's a useful change to see in PMM. But we'd also like to follow the reads that Readyset handles: when they hit the cache, when results refresh, and how replication is progressing.
We brought that view into Percona Monitoring and Management (PMM) through its external-service support. Readyset already has Grafana dashboards in its repository, so we could start with those and watch them fill with data. Here's how to connect the two in your own PMM installation.
PMM can monitor Readyset by adding it as an external service and importing Readyset's Grafana dashboards. In this blog we will walkthrough how to do it using Readyset 1.32.0 from the official stable GitHub release and PMM 3.10.0. We tested MySQL 8.4.13 and PostgreSQL 16.15 separately on AWS, with one Readyset deployment in each run.
Connect Readyset to PMM
Prometheus metrics are enabled by default. By default Readyset listens on 0.0.0.0:6034, exposing port 6034 on all IPv4 interfaces. We recommend restricting access to the metrics port to your monitoring network if you're not behind a private network by configuring PROMETHEUS_METRICS or METRICS_ADDRESS.
For a package installation, install PMM Client on the Readyset server and register it with your running PMM Server using Percona's PMM Client installation and registration guide.
Once PMM Client is registered, add Readyset as an external service:
pmm-admin add external \
  --service-name=readyset-cache \
  --listen-port=6034 \
  --metrics-path=/metrics \
  --scheme=http \
  --metrics-mode=push \
  --group=readyset \
  --skip-connection-check
A successful registration reports:
External Service added.
The service appears as readyset-cache.
PMM's --metrics-mode=push controls delivery of monitoring data to PMM Server, regardless of the Readyset cache type.
How do you import the Readyset dashboards into PMM?
With push-based caching, Readyset updates cached results from the database replication stream. Pull-based caching refreshes results by querying the database according to the cache policy. Download the corresponding dashboards from the Readyset repository at the tested release:
| Dashboard | File | Use it for |
|---|---|---|
| Pull-based Caching | shallow_caching.json | Cache hits, misses, and refresh activity. |
| Replication Performance | replication_performance.json | The replication path used by push-based caching. |
The repository retains the filename shallow_caching.json. Name that dashboard Pull-based Caching during import.
If PMM monitors several Readyset deployments, the Replication Performance dashboard needs changes before you can use it to inspect one deployment. It has no deployment selector, and its unmodified queries do not isolate a deployment. The Pull-based Caching dashboard does have that selector.
Both dashboards use PMM's Metrics data source. With the JSON file downloaded, we can turn those metrics into a dashboard.
Open the import page. In PMM, choose All dashboards, open New, and click Import.
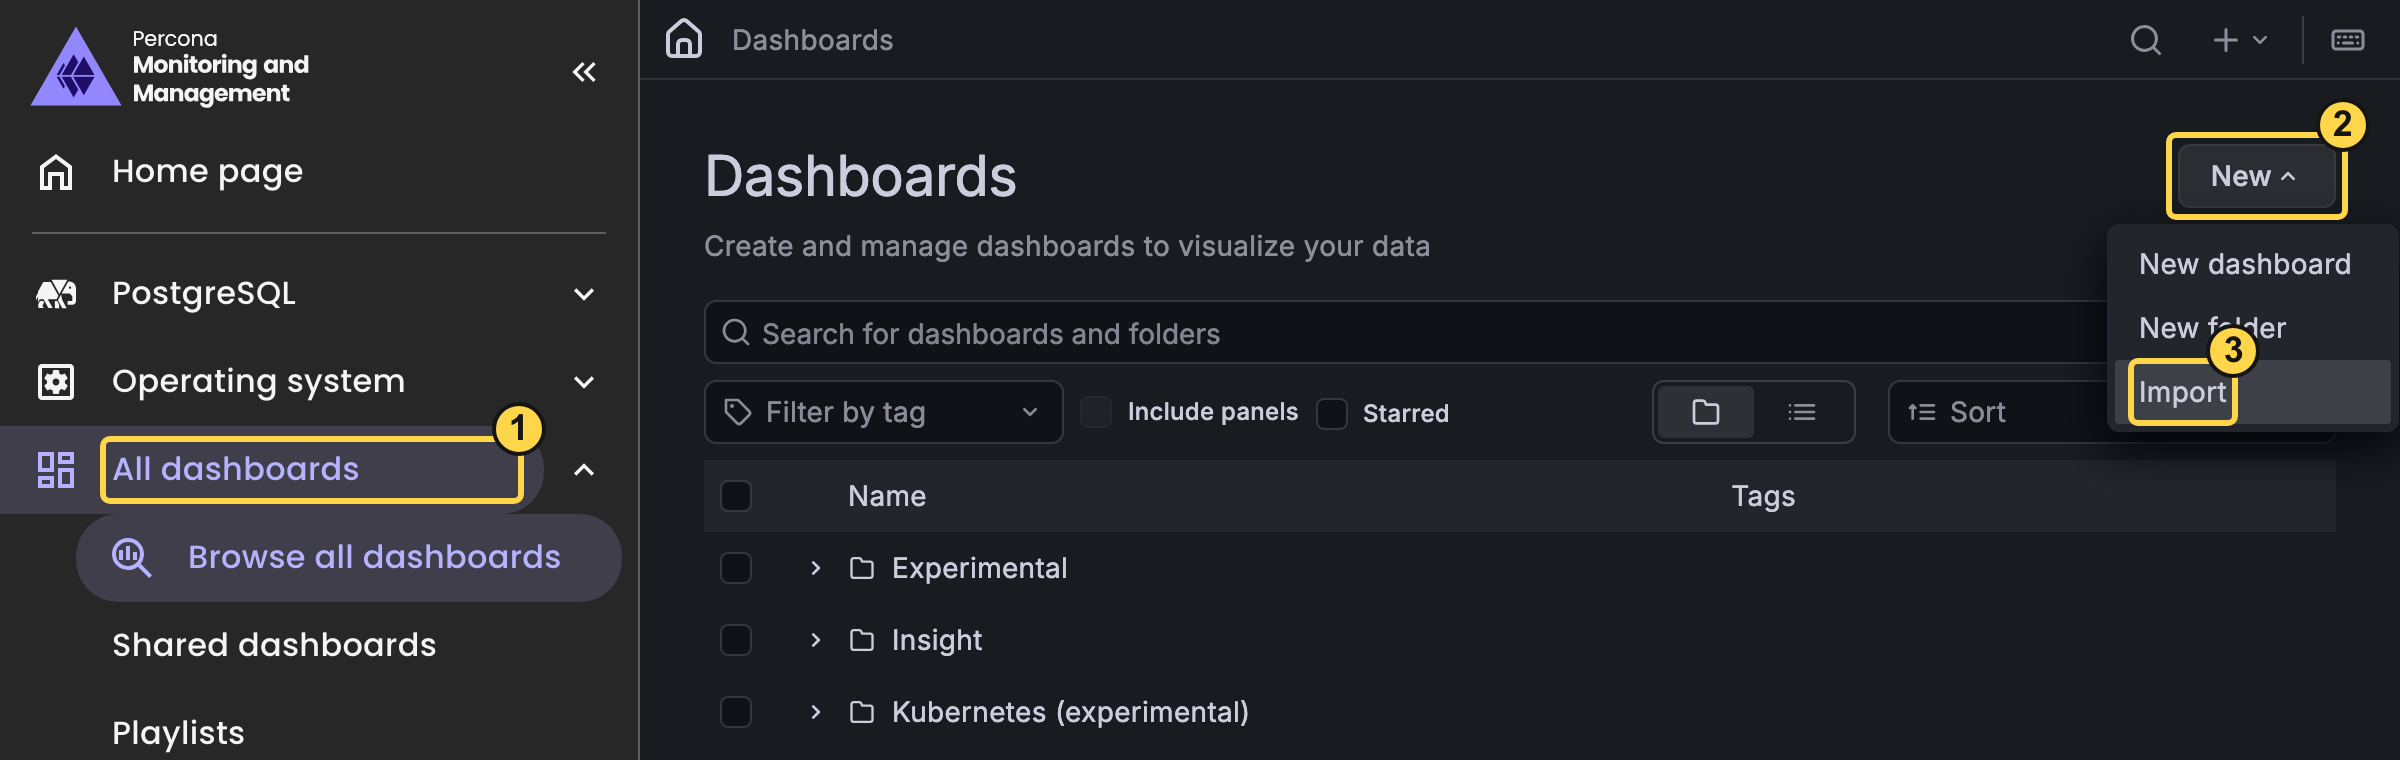
Follow the highlights: 1. All dashboards, 2. New, 3. Import.
Load the dashboard definition. Open the downloaded JSON file and copy its contents. Paste them under Import via dashboard JSON model, then click the Load button directly beneath that field.
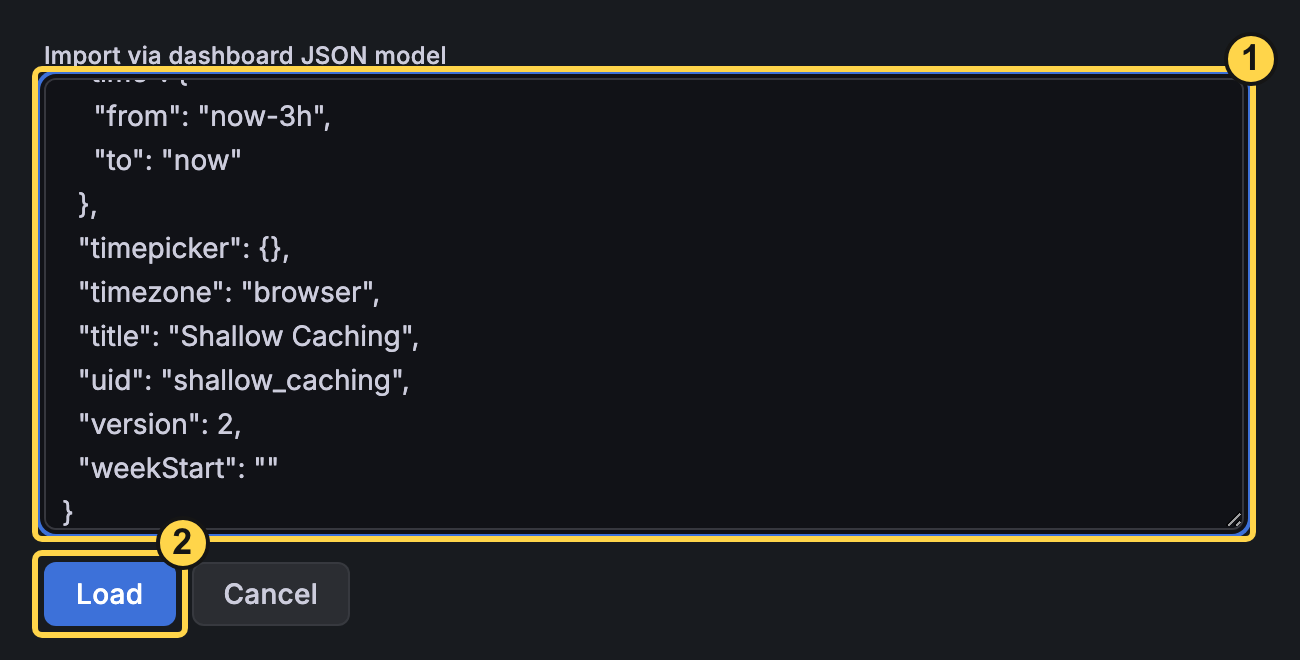
1. Paste the dashboard JSON. 2. Click Load beneath the JSON field.
Connect the dashboard to your metrics. For the pull-based dashboard, set the name to Pull-based Caching. Select Metrics for the DS_PROMETHEUS input, then click Import. Repeat the process with the Replication Performance JSON file, keeping its dashboard name.
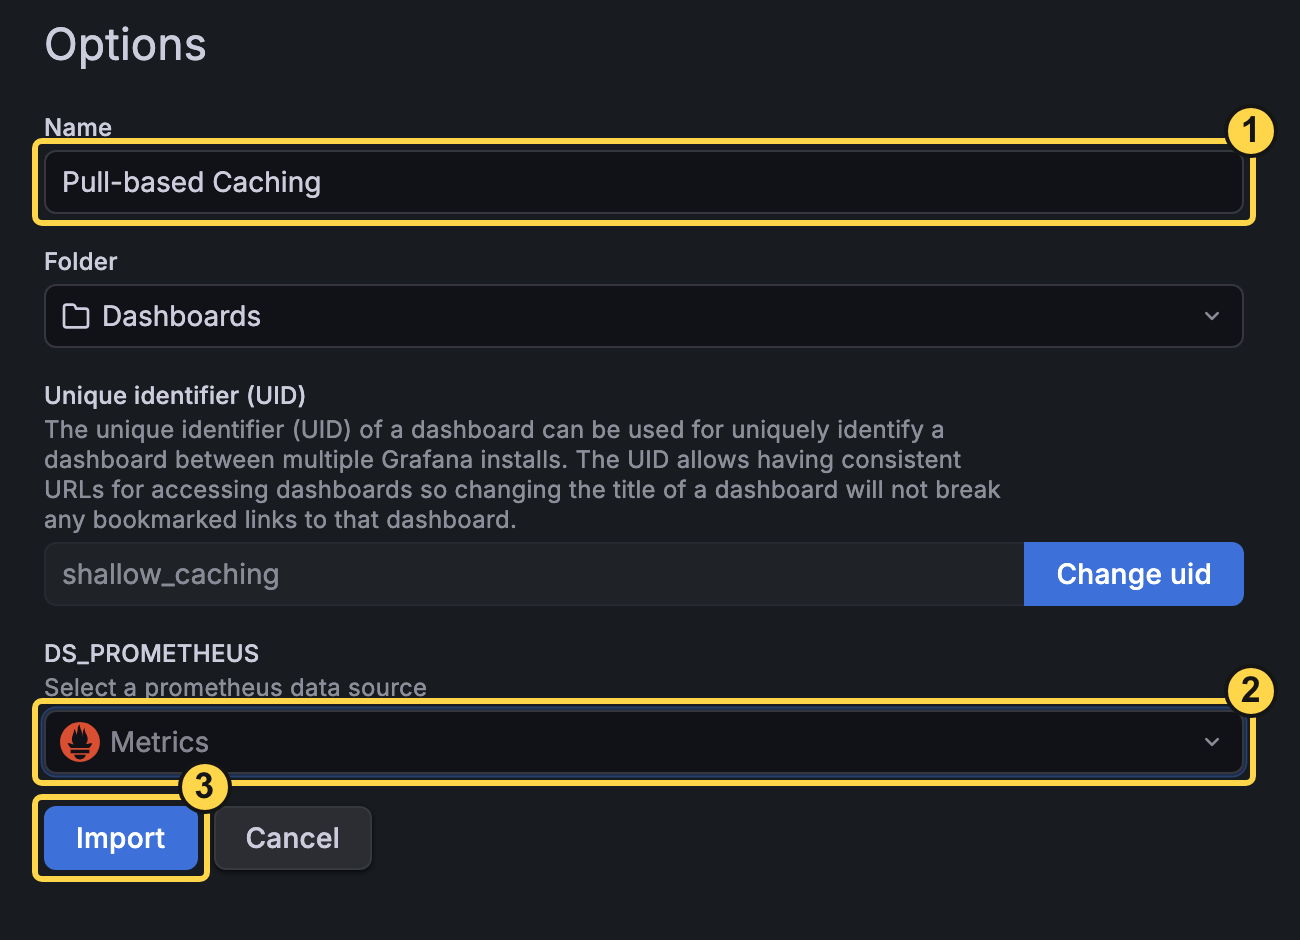
1. Set the dashboard name. 2. Choose Metrics. 3. Click Import.
For Pull-based Caching, select your Readyset deployment, leave Query Filter set to All, and choose a time range covering your application's activity. Last 15 minutes covered our test queries.
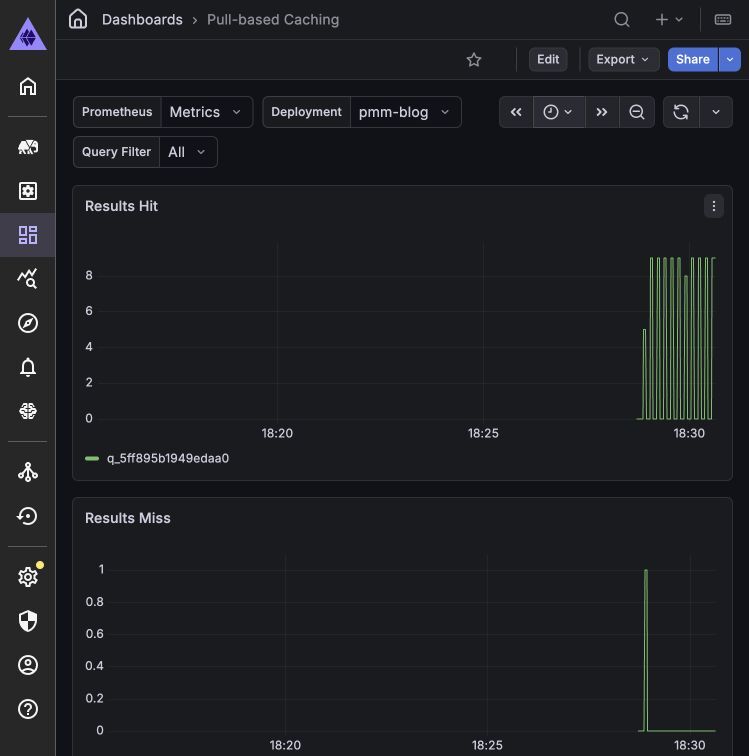
The existing repository dashboard, imported into PMM and populated by live queries. Only the display name and data-source mapping were changed.
Validate Readyset Performance with Percona PMM
With the dashboard open, we ran reads through Readyset and saw cache hits, misses, and refresh activity appear. Across the MySQL and PostgreSQL runs, all 27 dashboard expressions executed successfully; 25 returned series in each run.
The connection also stayed registered after restarting PMM Client: the service and agent identifiers were retained, and fresh metrics arrived afterward.
If you follow until here, now it's your turn. Try it with a query you know. Choose a read whose results can tolerate some delay after an update, cache it in a test environment using the Readyset cache guide, and run it repeatedly while watching the dashboard. Keep the database's PMM monitoring open too. We found this a useful starting point for following the work Readyset serves alongside the work that still reaches the database.
Feedback is welcome. If you need a dashboard that isn't covered here, tell us what you'd like to monitor by opening an issue at Readyset github. We're happy to add it.
Related articles
Continue reading more about tutorials.
TutorialsVinicius Grippa
Readyset HA with ProxySQL and MySQL
A MySQL source, a replica and a ProxySQL in front of both. Adding a highly available Readyset cache behind one slow report query took two docker run commands and two INSERT statements, with no change to the application, the schema or MySQL. Here is the measurement, the routing, and how to check the cache is really serving.
2026-10-2213 min read
Tutorials Vinicius Grippa
Readyset Is Ready for MySQL 9.7 - Three Commands With rdst
MySQL 9.7.0 LTS landed today, and we had the pleasure of watching the announcement live — and we were the first ones to download. If you've already pulled the binaries and you're poking at it in a lab, here's the news: Readyset already supports it. The point isn't that Readyset happens to work with 9.7. The point is that we were prepared for the launch. Our compatibility matrix has been running 9.7 pre-release builds, so the same readysettech/readyset:latest image you can docker pull right now
Vinicius Grippa2026-04-227 min read
Tutorials Michael Virga
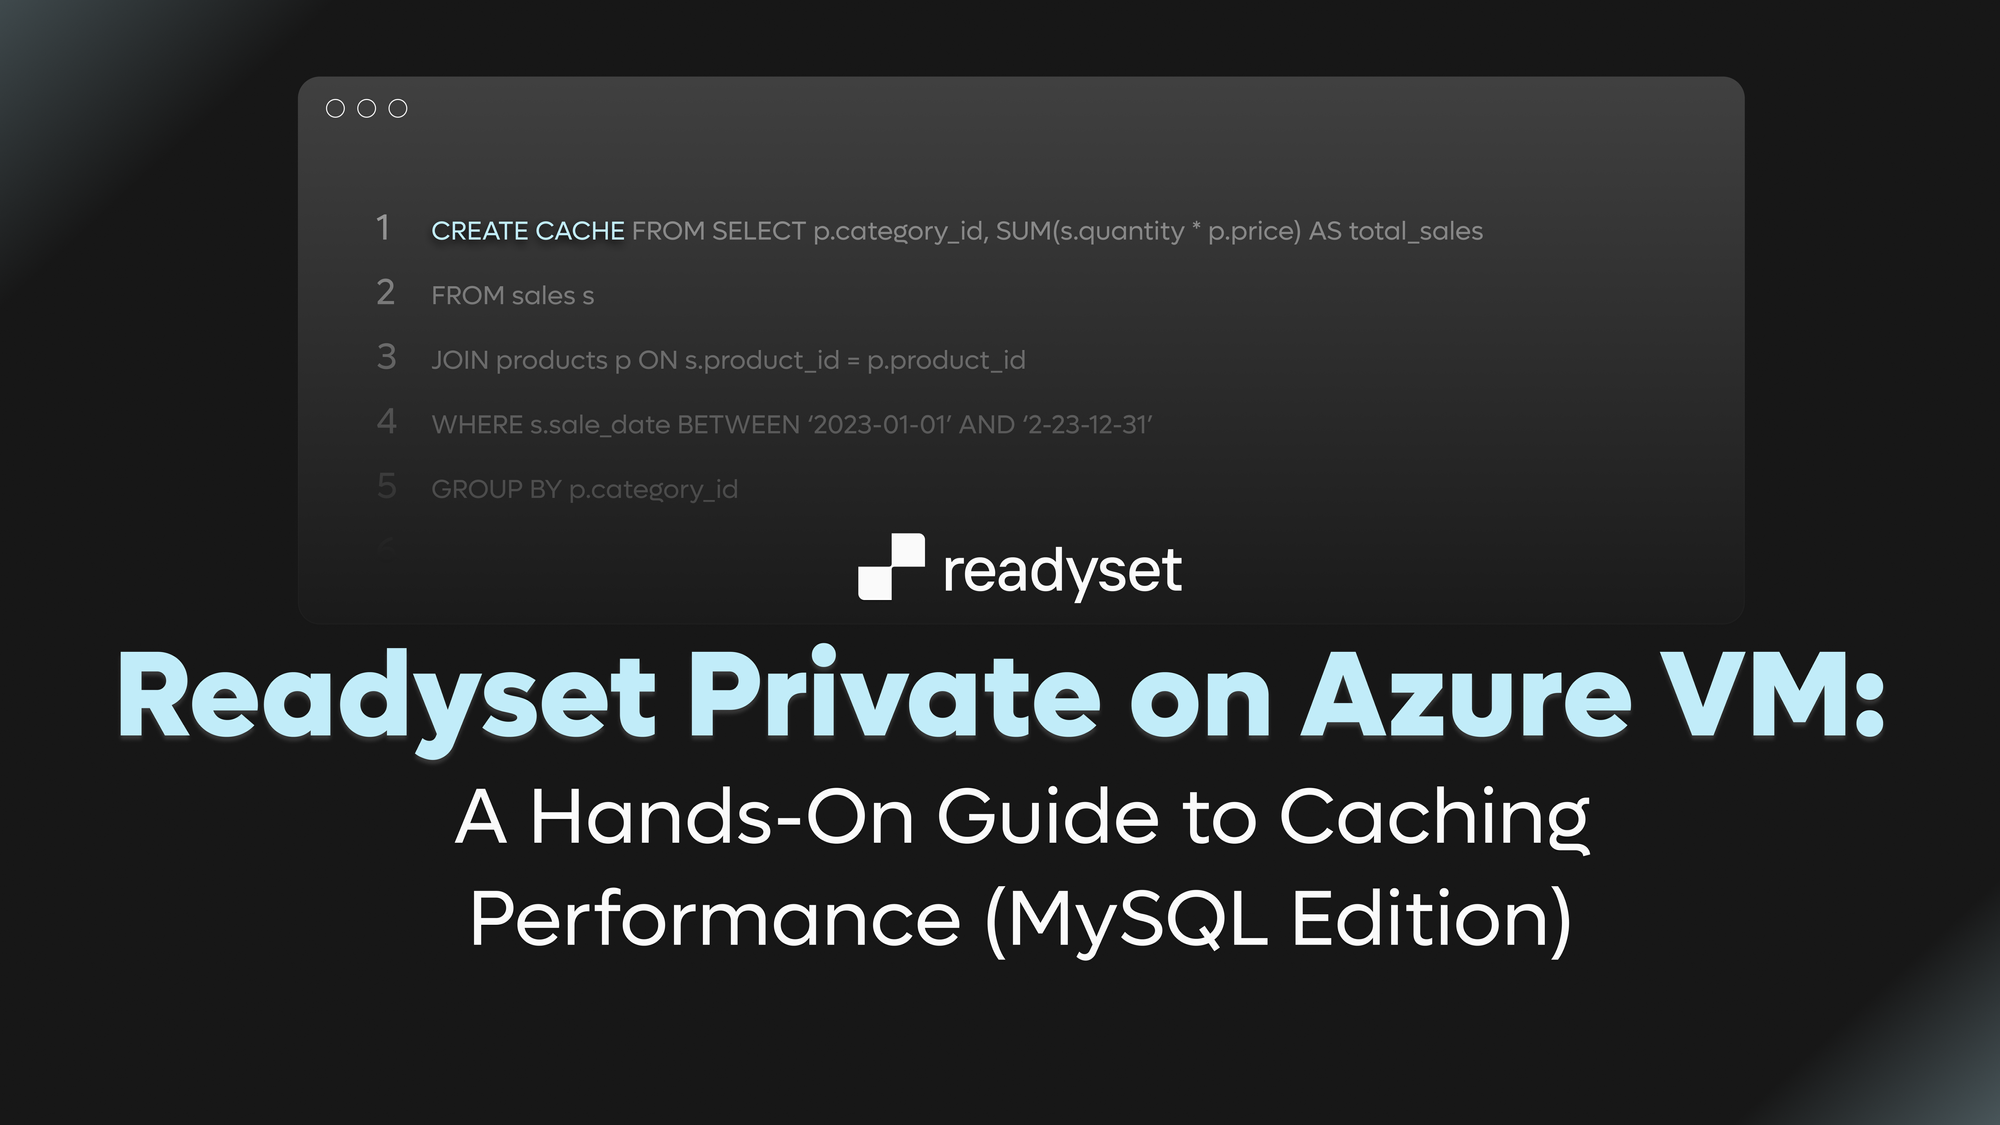
Readyset Private on Azure VM: A Hands-On Guide to Caching Performance (MySQL Edition)
"What if scaling reads didn’t require replicas, rewrites, or added infrastructure complexity? This post walks you through running Readyset—a caching layer purpose-built for real-time SQL acceleration—on Azure VM with MySQL. In just a few commands, you'll launch a MySQL database, deploy Readyset, and witness query speeds drop from milliseconds to microseconds." Prerequisites Before we dive in, ensure you're authenticated with Azure and have a role that includes permission to: * Create Azure
Michael Virga2025-04-286 min read