← Back to blogTutorials
Readyset HA with ProxySQL and MySQL
A MySQL source, a replica and a ProxySQL in front of both. Adding a highly available Readyset cache behind one slow report query took two docker run commands and two INSERT statements, with no change to the application, the schema or MySQL. Here is the measurement, the routing, and how to check the cache is really serving.
Vinicius Grippa
2026-10-22 · 13 min read
A query cache stores the result of a SQL query and answers later identical queries from that stored copy instead of running them again. Readyset is a query cache for MySQL and PostgreSQL that works as a proxy: it speaks the database's wire protocol, so it can decide per query whether to answer from cache or pass the query through.
Speaking the wire protocol is what makes Readyset drop-in: anything that can connect to MySQL can connect to Readyset instead, with no driver or query change. Put two Readyset nodes behind ProxySQL and you have a cache tier that survives losing a node.
We wanted to know how small that change really is when the topology already
exists. So we built the boring version of a production setup, a MySQL source
with a replica and a pair of ProxySQL nodes in cluster mode in front of both,
gave it a report query that costs 106 ms, and counted the steps needed to put a
highly available (HA) cache behind that one query. It came to two docker run
commands and two INSERT statements in ProxySQL's admin interface. Nothing in the application changed,
and neither did the schema or MySQL's configuration.
What a ProxySQL and MySQL topology looks like before Readyset
Seven machines in one availability zone, all c6i.large, which is 2 virtual
central processing units (vCPUs) and 4 GiB of memory each. MySQL 8.0.46 on the
source and on the replica, two ProxySQL 2.6.5 nodes in front of them, and the
sakila sample database loaded on the
source and replicated down.
Both ProxySQL nodes are configured the way most people configure one: hostgroup
10 is the writer, hostgroup 20 is the reader, writes go to the source, and a
catch-all rule sends anything matching ^SELECT to the replica.
The two proxies run in ProxySQL's cluster mode, which makes them peers. Each
lists the other in proxysql_servers, they share a cluster credential, and a
configuration change applied to either one is pulled by the other within a few
seconds. That is why adding Readyset below costs the same two statements it
would cost with a single proxy.
| Hostgroup | Backend | Purpose |
|---|---|---|
| 10 | MySQL source | all writes |
| 20 | MySQL replica | all reads |
Everything in grey below was already running. Everything in green is what this post adds.
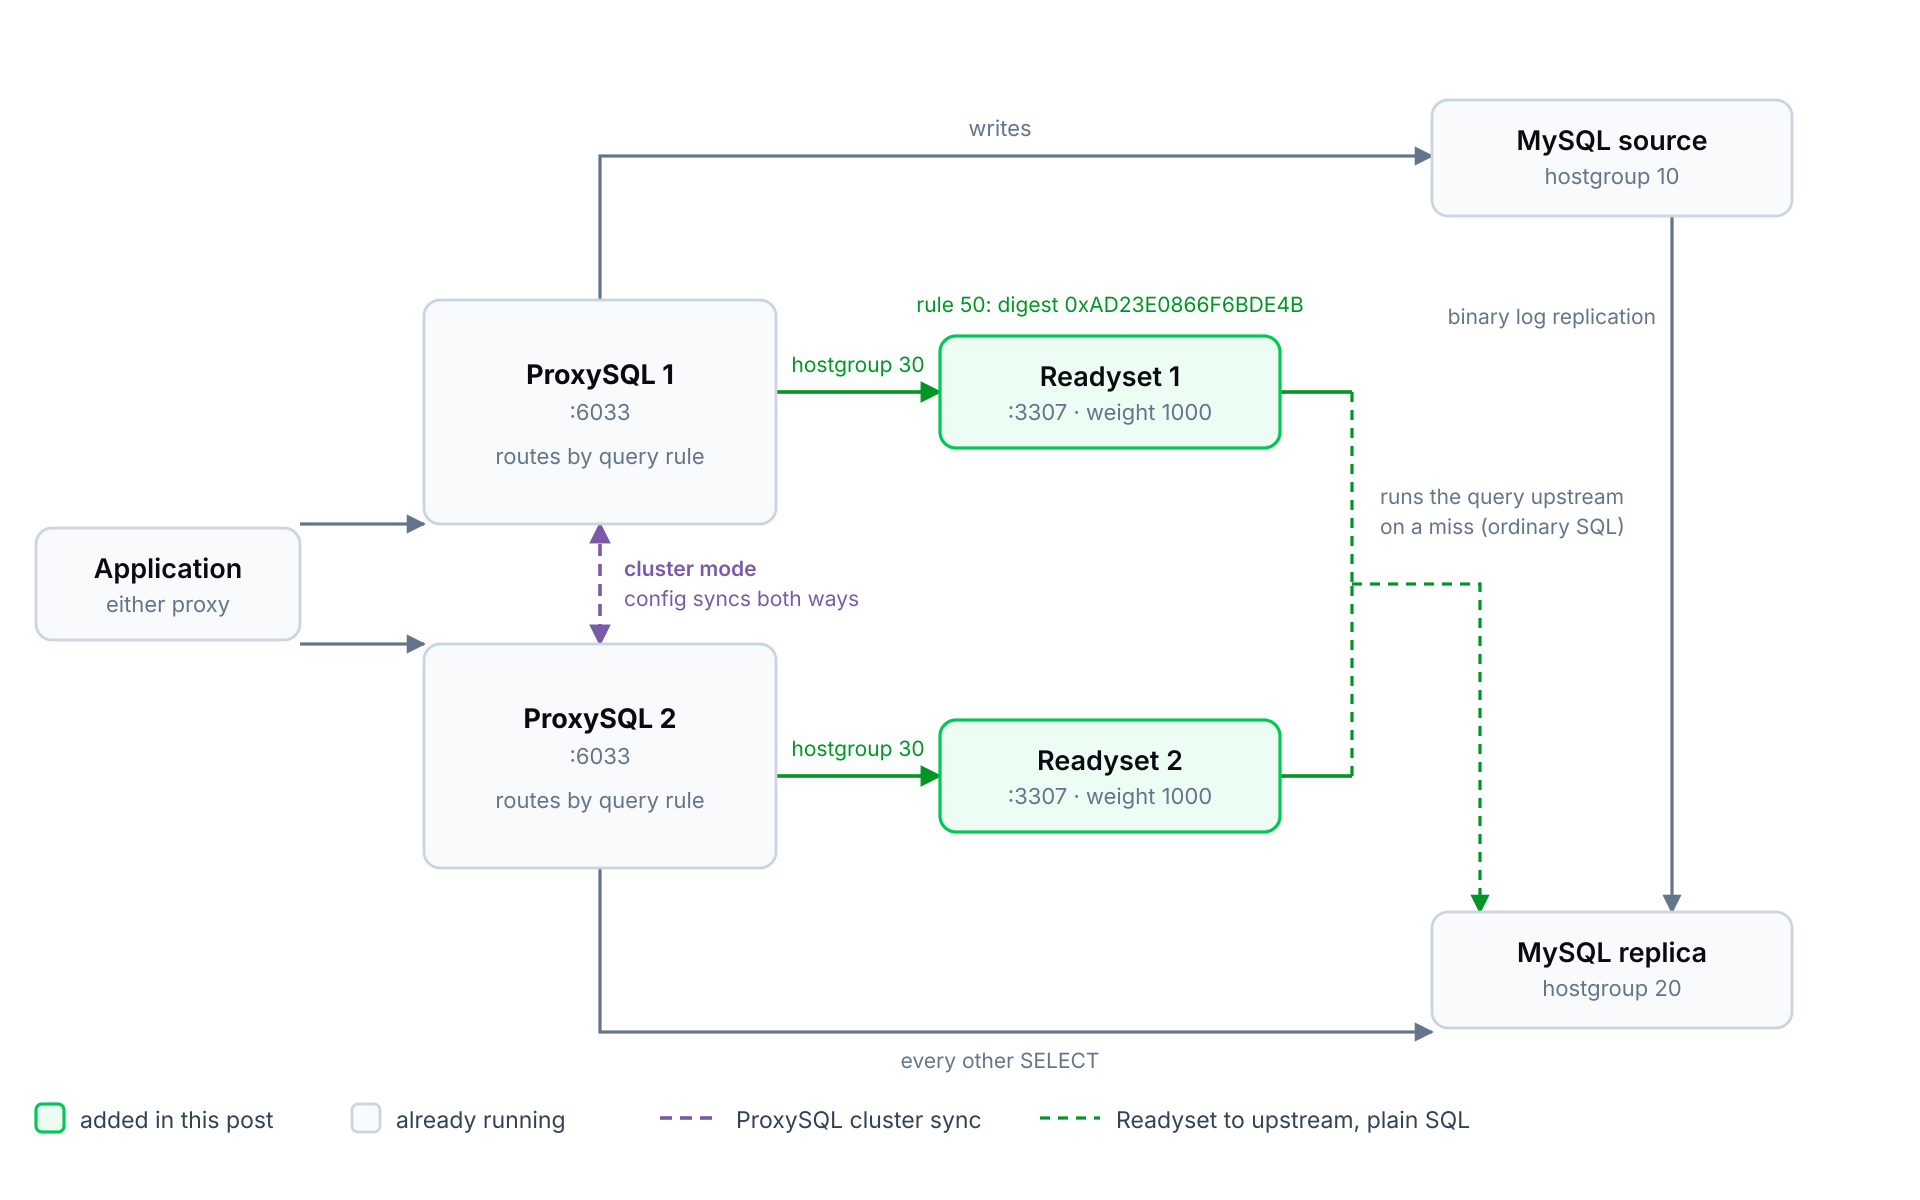
The two Readyset nodes and the hostgroup 30 routing are the whole change. Readyset connects to the replica as an ordinary SQL client, so there is no replication stream into it and nothing to configure on MySQL. The purple link is ProxySQL's cluster sync, which is why the routing has to be added on only one of the two proxies.
Which query is worth caching, and how ProxySQL tells you
ProxySQL already knows. It keeps a digest table of every query shape it has seen, with the total time spent on each, and the answer falls out of one query against the admin interface on port 6032.
SELECT hostgroup AS hg, digest, count_star AS calls,
       ROUND(sum_time/1000000,1) AS total_s,
       ROUND(sum_time/count_star/1000,1) AS avg_ms,
       substr(digest_text,1,50) AS query
  FROM stats_mysql_query_digest
 ORDER BY sum_time DESC LIMIT 5;
hg   digest              calls  total_s  avg_ms  query
20   0xAD23E0866F6BDE4B  140    28.0     200.0   SELECT c.customer_id,c.first_name,c.last_name,ci.c
20   0xDDE78179CF5B1440  1      0.0      1.0     SELECT COUNT(*) FROM film
20   0xAC447120122130DE  1      0.0      0.0     SELECT COUNT(*) FROM actor
10   0xFE0D5031018F599A  2      0.0      0.0     SET NAMES utf8mb4
The ProxySQL admin interface is SQLite underneath, so substr() works and
LEFT() does not. One shape accounts for all of the time. It is a customer
leaderboard: the top 25 customers by lifetime value, each annotated with the
film category they spend the most on.
SELECT c.customer_id, c.first_name, c.last_name, ci.city,
       SUM(p.amount)       AS lifetime_value,
       COUNT(p.payment_id) AS payments,
       (SELECT cat.name
          FROM payment p2
          JOIN rental r2        ON r2.rental_id    = p2.rental_id
          JOIN inventory i2     ON i2.inventory_id = r2.inventory_id
          JOIN film_category fc ON fc.film_id      = i2.film_id
          JOIN category cat     ON cat.category_id = fc.category_id
         WHERE p2.customer_id = c.customer_id
         GROUP BY cat.name
         ORDER BY SUM(p2.amount) DESC
         LIMIT 1)           AS top_category
  FROM customer c
  JOIN address a  ON a.address_id  = c.address_id
  JOIN city ci    ON ci.city_id    = a.city_id
  JOIN payment p  ON p.customer_id = c.customer_id
 GROUP BY c.customer_id, c.first_name, c.last_name, ci.city
 ORDER BY lifetime_value DESC
 LIMIT 25;
This query is not a straw man. EXPLAIN shows every join resolving through an
index, and sakila is about 10 MB against a 2 GB buffer pool, so the whole
working set is in memory and no read touches a disk. It costs 106 ms anyway,
because the correlated subquery is a DEPENDENT SUBQUERY that MySQL evaluates
once per customer. That is 599 executions of a five-table join, each building a
temporary table and sorting it, on every single call.
Why not just rewrite the slow query
That is the first thing a database engineer asks, so we measured it. We rewrote the correlated subquery as a window function over a common table expression, which is the textbook fix, and ran both forms against the same replica.
| Form | p50 latency | Queries per second |
|---|---|---|
| Original, with correlated subquery | 106.360 ms | 9.44 |
Rewritten with ROW_NUMBER() over a common table expression | 88.595 ms | 11.32 |
Single connection, 8 s warmup and 25 s measured, read directly against the MySQL replica.
The rewrite is worth 1.2x. The work being done is the same either way: aggregate 16,044 payments across a five-table join, then do the whole thing again for the next caller. Routing the query to Readyset is worth 149x on the same hardware, and it gets there by skipping the work rather than by doing it faster.
The minimal steps to add Readyset behind ProxySQL
Three commands total, and none of them touch MySQL, the application, or the second proxy.
First, run Readyset on two hosts. Each one is independent of the other, with no
shared state and no clustering to configure. AUTO_CACHE=true is the whole
configuration: it is shorthand for --cache-mode=shallow --query-caching=inrequestpath, which means every previously unseen SELECT
becomes a candidate for a cache that Readyset creates by itself, on the request
path, the first time it sees the query.
docker run -d --name readyset --restart unless-stopped \
  -p 3307:3307 -p 6034:6034 \
  -e UPSTREAM_DB_URL=mysql://app:readyset@<replica-ip>:3306/sakila \
  -e LISTEN_ADDRESS=0.0.0.0:3307 \
  -e AUTO_CACHE=true \
  public.ecr.aws/readyset/readyset:latest-nightly
We pointed both nodes at the read replica rather than the source, so the queries Readyset runs upstream land on the machine that already serves reads.
Docker is here because it makes the deployment one command that a reader can run
verbatim, which is what a demonstration needs. It is not the only option: the
same adapter ships as .deb and .rpm packages for x86_64 and arm64, run under
systemd and configured through /etc/readyset/readyset.conf. Both paths are
covered at
Install Readyset Cache. The flags
below are the same either way, as environment variables in Docker or as settings
in the configuration file.
Both nodes were accepting connections about 45 seconds after docker run
returned, and that is the whole startup. In shallow mode Readyset does not
replicate, which the log states plainly:
INFO readyset_server::controller::inner: Replication disabled; skipping snapshotting and replication
No replication user, no binary-log position, no snapshot of the dataset, no publication and no slot. Readyset connects to the upstream the same way any client does, runs the query on a miss, and keeps the result.
Second, tell ProxySQL the nodes exist, and point one query shape at them. This is the only change to the existing topology, and in cluster mode it is applied to one proxy rather than to each of them.
-- Hostgroup 30 is the new cache tier. The replica joins it at weight 1, which
-- makes it an automatic fallback: it takes 1 read in 2001 while Readyset is
-- healthy, and all of them when both Readyset nodes are gone.
INSERT INTO mysql_servers (hostgroup_id, hostname, port, weight, max_connections, comment)
VALUES (30, '<readyset-1-ip>', 3307, 1000, 500, 'readyset-1'),
       (30, '<readyset-2-ip>', 3307, 1000, 500, 'readyset-2'),
       (30, '<replica-ip>',    3306,    1, 500, 'mysql-replica-fallback');

-- Route exactly one query shape at the cache, by the digest ProxySQL reported.
INSERT INTO mysql_query_rules (rule_id, active, digest, destination_hostgroup, apply)
VALUES (50, 1, '0xAD23E0866F6BDE4B', 30, 1);

LOAD MYSQL SERVERS TO RUNTIME;
LOAD MYSQL QUERY RULES TO RUNTIME;
SAVE MYSQL SERVERS TO DISK;
SAVE MYSQL QUERY RULES TO DISK;
Routing by digest rather than by table is what keeps the change small. The same tables keep serving hostgroup 20 for every other query. Only this one shape moves.
We ran that against proxysql-1 and nothing at all against proxysql-2. The
second proxy picked the change up on its own in 3.7 seconds:
### proxysql-2 BEFORE, nothing applied to it directly
hostgroup 30 servers: 0
rule 50 present:      0

### applying the change to proxysql-1 ONLY
propagated to proxysql-2 in 3.7s, with no command run against it

### proxysql-2 AFTER
30   172.31.38.52    3306     1  mysql-replica-fallback
30   172.31.39.254   3307  1000  readyset-1
30   172.31.44.109   3307  1000  readyset-2
rule 50:
50   1   0xAD23E0866F6BDE4B   30
That is what cluster mode buys. Adding a cache tier to a pair of proxies is the same two statements as adding it to one, so the two proxies cannot drift into routing the same query differently.
One credential detail is easy to miss. Readyset authenticates incoming clients
against its own upstream user, so the user ProxySQL uses for its backend
connections has to be the same user that appears in UPSTREAM_DB_URL. A
separate application user gets an access denied error at the Readyset
connection.
What changed after routing one query to Readyset
Same driver, same ProxySQL endpoint, same query text. The only difference between the two halves of each pair is whether rule 50 is active.
| Concurrency | MySQL p50 | Readyset p50 | MySQL q/s | Readyset q/s | Latency ratio |
|---|---|---|---|---|---|
| 1 | 106.376 ms | 0.716 ms | 9.43 | 1291.93 | 149x |
| 4 | 396.784 ms | 2.401 ms | 10.27 | 1463.33 | 165x |
| 8 | 795.061 ms | 5.398 ms | 10.33 | 1301.70 | 147x |
10 s warmup, 30 s measured, zero errors in every run. Latency ratio is p50 against p50.
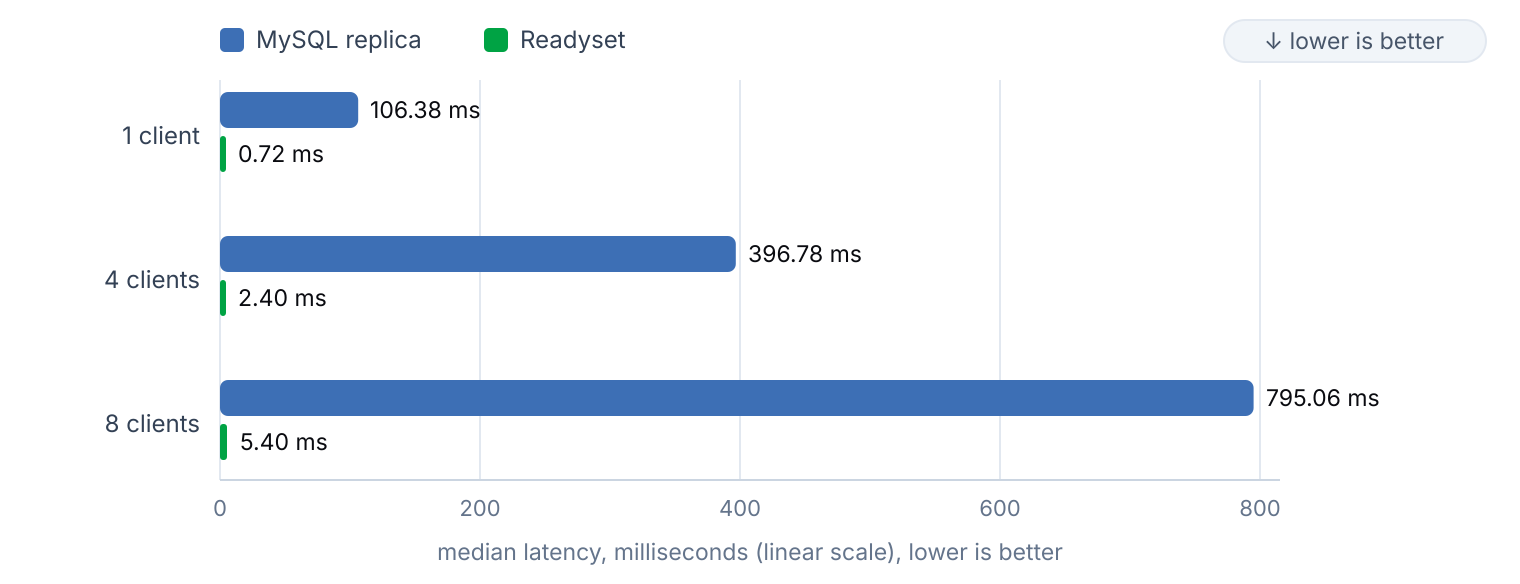
The Readyset bars are drawn at a 3 pixel minimum so they are visible at all; at this scale their true widths are half a pixel. These are 2 vCPU demo machines and one query, so read the shape rather than the absolute numbers.
The rows come back identical. We compared the full result set and every field of every column definition between the cached path and the replica read directly: 25 rows, 7 columns, byte for byte the same.
How to confirm Readyset served the reads
A cache that exists is not a cache that is being used, and the failure mode looks like success: correct rows at a plausible latency, quietly served by the database. So we checked three separate things.
ProxySQL answers the first two: is the rule firing, and where did the query actually go. Both come from the admin interface on port 6032.
-- is the routing rule matching, and how often
SELECT s.rule_id, s.hits, r.destination_hostgroup
  FROM stats_mysql_query_rules s
  JOIN runtime_mysql_query_rules r USING(rule_id)
 ORDER BY s.rule_id;

-- and which hostgroup actually served that query shape
SELECT hostgroup, digest, count_star
  FROM stats_mysql_query_digest
 WHERE digest = '0xAD23E0866F6BDE4B';
We sent 800 reads at proxysql-1 and 400 at proxysql-2, and each proxy counted
only its own share:
--- proxysql-1 (drove 800) ---
hostgroup  digest              count_star
30         0xAD23E0866F6BDE4B  800

--- proxysql-2 (drove 400) ---
rule_id  hits  destination_hostgroup
50       400   30
100      1     20
hostgroup  digest              count_star
30         0xAD23E0866F6BDE4B  400
Both proxies send the digest to hostgroup 30, and rule 100, the pre-existing
catch-all, still handles everything else. One caveat if you run this yourself:
stats_mysql_query_rules is flushed asynchronously, so straight after a burst it
can lag the digest table by a few seconds before the two agree.
That proves the query reached Readyset. It does not prove Readyset answered from cache rather than passing the query upstream, which is the failure that looks exactly like success. Readyset's own per-query counters settle it:
curl -s localhost:6034/metrics | grep readyset_shallow_shallow_result
--- readyset-1 ---
readyset_shallow_shallow_result_hit{...,query_id="q_d618b5595f3efeab"}  98347
readyset_shallow_shallow_result_miss{...,query_id="q_d618b5595f3efeab"}     5
--- readyset-2 ---
readyset_shallow_shallow_result_hit{...,query_id="q_d618b5595f3efeab"}  93984
readyset_shallow_shallow_result_miss{...,query_id="q_d618b5595f3efeab"}     5
Hits move with the traffic and misses stay in single digits. Both nodes built the same cache for the same query identifier on their own, and both carried roughly half the reads. A Readyset node whose hit counter is flat while queries flow through it is serving everything from the database, and this is the counter to alert on.
Then we measured the instrument itself. A bare SELECT 1 over the same path,
from the same driver through the same ProxySQL, costs 0.280 ms at p50. That is the client
library, two network hops and the proxy, and it is 39% of Readyset's 0.716 ms.
Readyset's own contribution to the cached read is closer to 0.44 ms.
What happens when a Readyset node or a ProxySQL node dies
Two tiers can now lose a node, so we killed one on each.
We ran the query continuously with four clients and stopped the Readyset nodes underneath it, checking every second whether the application was still getting correct answers.
| Event | What the client saw |
|---|---|
docker stop on Readyset 1 | three errored connections in the second it happened, then cached reads again from the survivor |
docker stop on Readyset 2, both now gone | reads served by the replica through the weight 1 fallback |
| Throughout | no second passed without completed queries, and the top row of the report never changed |
Losing one Readyset node did not show up in the latency series at all. The survivor absorbed the traffic and the application had no way to tell.
Then we did the same to a proxy, with the load running against proxysql-2 and
proxysql-1 stopped underneath it.
| Queries per second | p50 | |
|---|---|---|
| Load on proxysql-2, both proxies up | 1460 | 2.47 ms |
| Load on proxysql-2, proxysql-1 stopped | 1454 | 2.40 ms |
Zero errors, and no second without completed queries.
The client talking to the surviving proxy did not notice, which is what a second
proxy is for. Cluster mode also covers the rebuild. We brought proxysql-1 back
from an empty configuration, with its data volume deleted and --initial on the
command line, and it pulled the whole Readyset routing from its peer without
being told any of it.
hostgroup 30 on the rebuilt proxysql-1, which was never told about Readyset:
30   172.31.38.52    3306     1  mysql-replica-fallback
30   172.31.39.254   3307  1000  readyset-1
30   172.31.44.109   3307  1000  readyset-2
50   1   0xAD23E0866F6BDE4B   30
Losing both Readyset nodes fell through to the replica and the application kept working at the speed it had before Readyset existed. That is the useful property of the weighted fallback: the degraded mode is the system you already had, not an error page. The handful of errors across these runs were connections in flight when a container was killed, and a client with retry logic would have swallowed them.
We did not measure how much load a pair of Readyset nodes can take, so none of these figures is a capacity claim. Two 2 vCPU machines is a demonstration size, not a sizing exercise.
Where the Readyset and ProxySQL pattern applies
The topology has to be a proxy that can route by query shape, in front of at least one read query expensive enough that the round trip to Readyset is worth avoiding. On a query that already runs in 2 ms, none of this pays for itself, because the floor we measured is 0.342 ms of driver and network before Readyset does anything at all.
The two Readyset nodes are independent caches, not a cluster. There is no shared state between them and nothing to configure to pair them up, which is the opposite of the ProxySQL pair, where cluster mode is the whole point. ProxySQL spreads reads across both Readyset nodes and takes either one out of rotation on its own, and that is what makes the Readyset failover simple.
What kept the change small is that nothing in the application knew about it. The connection string still points at ProxySQL, and the query text, the schema and MySQL's configuration are all exactly what they were. Cluster mode kept it small in the other direction too: a second proxy did not mean a second copy of the work. One query moved from a hostgroup that costs 106 ms to a Readyset hostgroup that costs 0.716 ms, and the rest of the workload never noticed.
The documentation for shallow caching, the --auto-cache flag and the other
installation methods is at
Install Readyset Cache.
Related articles
Continue reading more about tutorials.
Tutorials Michael Virga
Readyset Private on Azure VM: A Hands-On Guide to Caching Performance (MySQL Edition)
"What if scaling reads didn’t require replicas, rewrites, or added infrastructure complexity? This post walks you through running Readyset—a caching layer purpose-built for real-time SQL acceleration—on Azure VM with MySQL. In just a few commands, you'll launch a MySQL database, deploy Readyset, and witness query speeds drop from milliseconds to microseconds." Prerequisites Before we dive in, ensure you're authenticated with Azure and have a role that includes permission to: * Create Azure
Michael Virga2025-04-286 min read
Tutorials Wagner Bianchi
Getting Started with Readyset on PostgreSQL
PostgreSQL is one of the most potent relational databases, but performance can become a bottleneck as queries become complex. One of the most effective ways to reduce query latency without modifying application logic is caching, and Readyset provides a seamless solution. Readyset sits between your application and PostgreSQL, automatically caching queries and speeding up their response times considerably. In this guide, we’ll walk through: Installing Readyset on Ubuntu 24.04 using a .deb packa
Wagner Bianchi2025-03-106 min read
TutorialsWagner Bianchi
Getting Started with Readyset on MySQL
Optimizing MySQL and PostgreSQL performance is crucial for modern applications, especially those with read-heavy workloads. Readyset is a drop-in SQL caching engine that sits between your application and the database. It automatically caches query results to improve response times without requiring application changes. In this post, we'll cover: Installing Readyset on Ubuntu 24.04 using a .deb package Configuring Readyset to connect to an upstream MySQL database Running queries and caching r
Wagner Bianchi2025-03-054 min read