
← Back to blogQuery Optimization
Identifying Cacheable Queries: Using tools like pt-query-digest or the MySQL sys schema to pinpoint queries that would benefit from caching
Introduction It’s common for DBAs to optimize queries to address bottlenecks and reduce resource contention. However, in production workloads, the most resource-intensive queries aren’t always the longest-running ones. High-frequency queries that execute quickly but are called repeatedly can collectively consume significant resources, increasing overall latency and system load. Identifying these queries requires a more comprehensive analysis than simply inspecting the slow query log or process
Vinicius Grippa
2025-05-29 · 10 min read
Introduction
It’s common for DBAs to optimize queries to address bottlenecks and reduce resource contention. However, in production workloads, the most resource-intensive queries aren’t always the longest-running ones. High-frequency queries that execute quickly but are called repeatedly can collectively consume significant resources, increasing overall latency and system load. Identifying these queries requires a more comprehensive analysis than simply inspecting the slow query log or process list.
A more effective approach involves analyzing query frequency and data access patterns, particularly focusing on queries with a skewed distribution. In many workloads, a small subset of queries accounts for the majority of database load, following the Pareto principle, where a small number of queries contribute to most of the issues. The chart below illustrates this principle: a small portion of queries causes a disproportionately high incidence of workload.
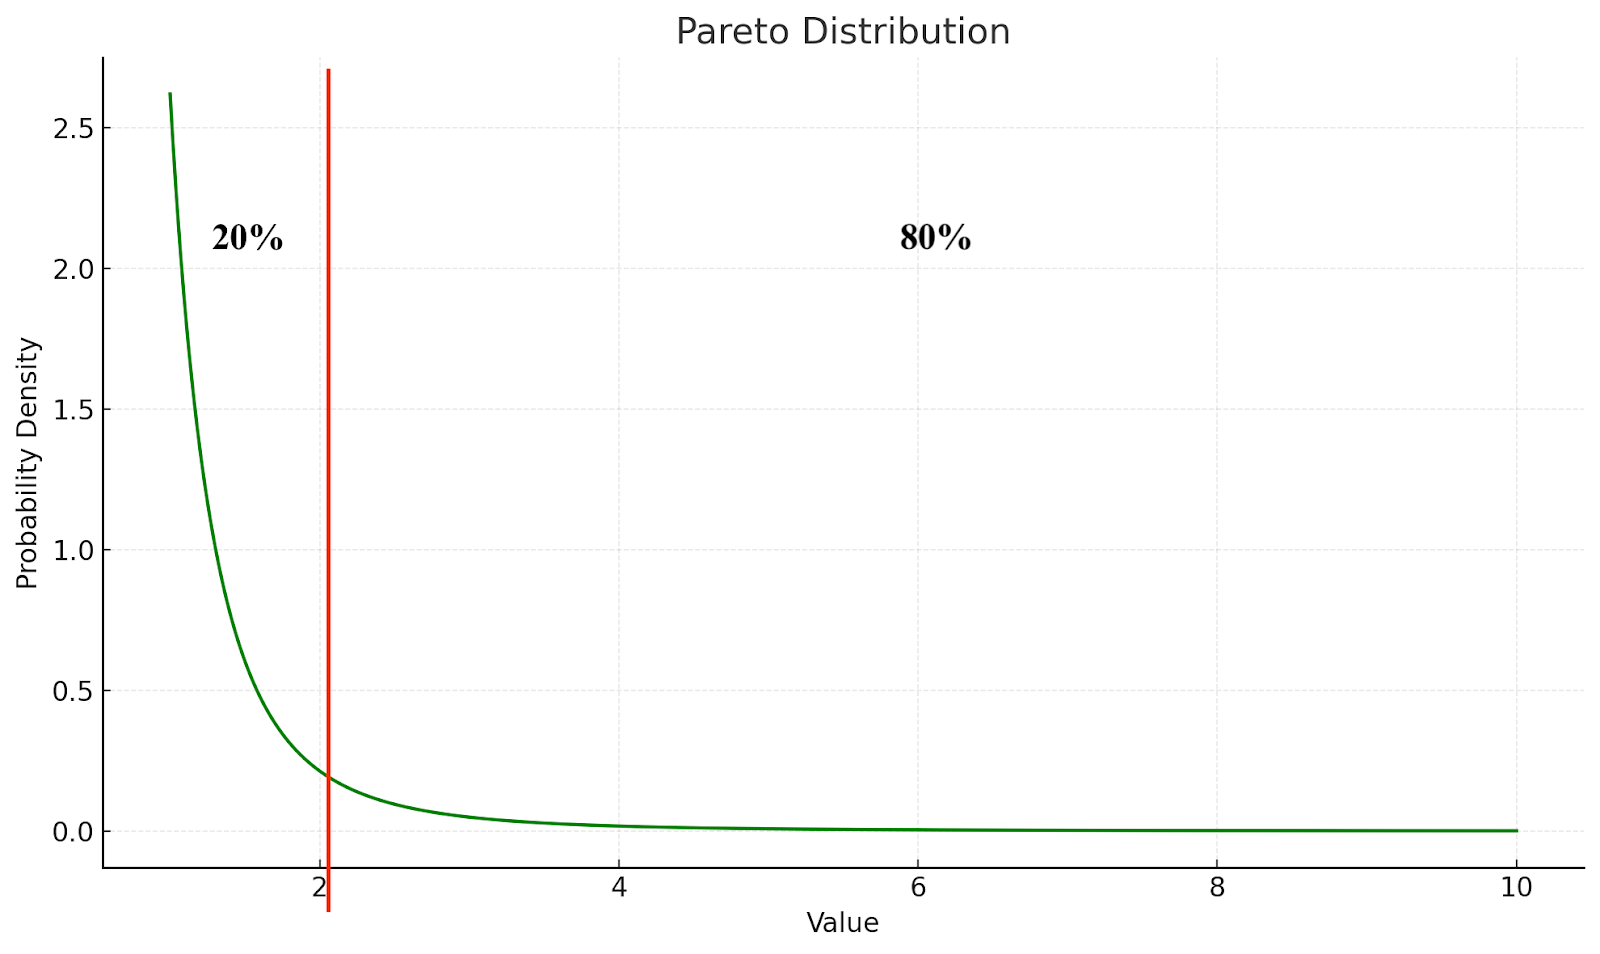
This means that by focusing on a small percentage of the queries, we can address the majority of performance problems. Working smarter, not necessarily harder, is often the most efficient path to better results.
In this post, we’ll explore how to use tools like pt-query-digest and the MySQL sys schema to identify high-frequency, cacheable queries and implement targeted optimizations using Readyset.
Capturing Workload Data
Before analyzing cacheable queries, it’s essential to capture accurate workload data. MySQL provides two main options for this: the Performance Schema (P_S) and the Slow Query Log.
The Performance Schema is a built-in mechanism that enables detailed profiling of query execution. It organizes events hierarchically, from transactions down to individual waits. This structure allows you to trace the lifecycle of a query and identify bottlenecks at each stage. Unlike the Slow Query Log, which is disabled by default, the Performance Schema is typically enabled with basic instrumentation.
For example, here’s a sample output using a Performance Schema query:
mysql > SELECT      DIGEST,      DIGEST_TEXT,      COUNT_STAR AS executions,      SUM_TIMER_WAIT / 1000000000000 AS total_latency_sec,      SUM_LOCK_TIME / 1000000000000 AS total_lock_time_sec,      SUM_ROWS_SENT AS rows_sent,      SUM_ROWS_EXAMINED AS rows_examined,      FIRST_SEEN,      LAST_SEEN  FROM      performance_schema.events_statements_summary_by_digest  ORDER BY      total_latency_sec DESC  LIMIT 1\G
*************************** 1. row ***************************
             DIGEST: c4abbf6653c63ebc5ce9c4b49f7bfd8711851dd9d968ed69244319850c548813
        DIGEST_TEXT: SELECT DISTINCTROW `e` . `emp_no` , `e` . `first_name` , `e` . `last_name` , MAX ( `s` . `salary` ) AS `highest_salary` FROM `employees` `e` JOIN `salaries` `s` ON `e` . `emp_no` = `s` . `emp_no` GROUP BY `e` . `emp_no` , `e` . `first_name` , `e` . `last_name` HAVING `highest_salary` > ? ORDER BY `highest_salary` DESC LIMIT ?
         executions: 61
  total_latency_sec: 6649.4135
total_lock_time_sec: 0.0004
          rows_sent: 610
      rows_examined: 191788941
         FIRST_SEEN: 2025-05-18 22:16:32.324267
          LAST_SEEN: 2025-05-18 22:44:34.113610
1 row in set (0.00 sec)
This kind of output gives a digest of the query text and key metrics like execution count and latency.
To make Performance Schema more easier to work with, MySQL includes the sys schema—a collection of views, procedures, and functions designed to convert raw P_S data into actionable insights. The example below shows how many of the sys schema views already suggest their purpose just by name:
mysql(sys) > show tables like '%statement%';
+-----------------------------------------------+
| Tables_in_sys (%statement%)                   |
+-----------------------------------------------+
| host_summary_by_statement_latency             |
| host_summary_by_statement_type                |
| statement_analysis                            |
| statements_with_errors_or_warnings            |
| statements_with_full_table_scans              |
| statements_with_runtimes_in_95th_percentile   |
| statements_with_sorting                       |
| statements_with_temp_tables                   |
| user_summary_by_statement_latency             |
| user_summary_by_statement_type                |
| x$host_summary_by_statement_latency           |
| x$host_summary_by_statement_type              |
| x$statement_analysis                          |
| x$statements_with_errors_or_warnings          |
| x$statements_with_full_table_scans            |
| x$statements_with_runtimes_in_95th_percentile |
| x$statements_with_sorting                     |
| x$statements_with_temp_tables                 |
| x$user_summary_by_statement_latency           |
| x$user_summary_by_statement_type              |
+-----------------------------------------------+
20 rows in set (0.00 sec)
You’ll see views like statements_with_full_table_scans and x$statements_with_runtimes_in_95th_percentile, which simplify query analysis.
The last method worth mentioning is the Slow Query Log. This traditional mechanism captures queries that exceed a threshold defined by the long_query_time parameter. By default, it’s turned off and set to 10 seconds. Here’s a sample log entry:
# Time: 2025-05-18T22:44:34.113510Z
# User@Host: sysbench[sysbench] @ localhost [127.0.0.1]  Id: 20284
# Schema: employees  Last_errno: 0  Killed: 0
# Query_time: 103.518173  Lock_time: 0.000007  Rows_sent: 10  Rows_examined: 3144081  Rows_affected: 0  Bytes_sent: 581
SET timestamp=1747608170;
/* Employees who received a salary above $120,000 */
SELECT DISTINCT e.emp_no, e.first_name, e.last_name, MAX(s.salary) AS highest_salary
FROM employees e
JOIN salaries s ON e.emp_no = s.emp_no
GROUP BY e.emp_no, e.first_name, e.last_name
HAVING highest_salary > 120000
ORDER BY highest_salary DESC
LIMIT 10;
Both the Performance Schema and the Slow Query Log have their trade-offs. Increasing the performance_schema_max_digest_length from the default 1024 bytes to 2048 can capture more query detail but raises memory usage. Lowering long_query_time to values like 0.3 seconds provides broader coverage but may increase disk I/O.
The key is to balance visibility with impact. It’s not just about capturing more data—it’s about capturing relevant data without overwhelming the server.
Analyzing the Slow Query Log with pt-query-digest
pt-query-digest is a powerful open-source tool from Percona that analyzes slow query logs and provides detailed breakdowns of query patterns, execution time, and frequency.
Installing pt-query-digest
To install pt-query-digest, run the following commands:
wget percona.com/get/pt-query-digest
chmod +x pt-query-digest
Generating a Report with pt-query-digest
With the slow_query_log enabled and the long_query_time appropriately set, we can proceed with generating the report. The following command processes the entire slow query log and outputs the analysis to a file:
./pt-query-digest --limit=100% /path/to/slow_query.log > slow_report.out
A sample output might look like this:
# 3.7s user time, 290ms system time, 50.75M rss, 120.27M vsz
# Current date: Sun May 18 22:44:07 2025
# Hostname: support-01.tp.int.percona.com
# Files: /home/vinicius.grippa/sandboxes/rsandbox_8_0_32/master/data/support-01-slow.log

# Profile
# Rank Query ID                            Response time   Calls R/Call
# ==== =================================== =============== ===== ========
#    1 0x94106BB6AC6179081ECBC3290DE9F4FD  5251.4310 40.7%    49 107.1721
#    2 0xC1C1F6C4D653F65959863343736F3440  1560.0465 12.1%    37  42.1634
#    3 0x318A4A6E8512F906A936EE933A8F6903  1424.9221 11.0%    83  17.1677
#    4 0xDBFF9C58A264436A87E953178115BB7D  1402.4261 10.9%    63  22.2607
#    5 0x51E61AF5EDF9E75EC3841241A40D4F5A  1371.5009 10.6%  1449   0.9465
These results show that two queries account for over 50% of the workload, making them strong candidates for optimization or caching. The report will also give you the queries and the individual analysis of each query. This is the sample of the first query:
# Query 1: 0.03 QPS, 3.29x concurrency, ID 0x94106BB6AC6179081ECBC3290DE9F4FD at byte 173343733
# This item is included in the report because it matches --limit.
# Scores: V/M = 2.28
# Time range: 2025-05-18T22:16:32 to 2025-05-18T22:43:08
# Attribute    pct   total     min     max     avg     95%  stddev  median
# ============ === ======= ======= ======= ======= ======= ======= =======
# Count          1      49
# Exec time     40   5251s     79s    135s    107s    130s     16s    107s
# Lock time      0   356us     5us    15us     7us     9us     1us     6us
# Rows sent      0     490      10      10      10      10       0      10
# Rows examine  11 146.92M   3.00M   3.00M   3.00M   3.00M       0   3.00M
# Rows affecte   0       0       0       0       0       0       0       0
# Bytes sent     0  27.80k     581     581     581     581       0     581
# Query size     0  14.69k     307     307     307     307       0     307
# String:
# Databases    employees
# Hosts        localhost
# Last errno   0
# Users        sysbench
# Query_time distribution
#   1us
#  10us
# 100us
#   1ms
#  10ms
# 100ms
#    1s
#  10s+  ################################################################
# Tables
#    SHOW TABLE STATUS FROM `employees` LIKE 'employees'\G
#    SHOW CREATE TABLE `employees`.`employees`\G
#    SHOW TABLE STATUS FROM `employees` LIKE 'salaries'\G
#    SHOW CREATE TABLE `employees`.`salaries`\G
# EXPLAIN /*!50100 PARTITIONS*/
/* Employees who received a salary above $120,000 */
SELECT DISTINCT e.emp_no, e.first_name, e.last_name, MAX(s.salary) AS highest_salary
FROM employees e
JOIN salaries s ON e.emp_no = s.emp_no
GROUP BY e.emp_no, e.first_name, e.last_name
HAVING highest_salary > 120000
ORDER BY highest_salary DESC
LIMIT 10\G
Using the sys Schema for Query Performance
The sys schema extends the Performance Schema and exposes aggregated insights. Some particularly useful views include:
- x$statements_with_runtimes_in_95th_percentile: Identifies queries in the 95th percentile for runtime.
- x$statements_with_full_table_scans: Highlights queries performing full table scans.
Identifying Long Running Queries (95th Percentile)
To identify the most resource-intensive queries by average runtime, we will use a mix of the sys schema and P_S :
SELECT schema_name,
       format_pico_time(total_latency) AS tot_lat,
       exec_count,
       format_pico_time(total_latency / exec_count) AS latency_per_call,
       query_sample_text
FROM sys.x$statements_with_runtimes_in_95th_percentile AS t1
JOIN performance_schema.events_statements_summary_by_digest AS t2
  ON t2.digest = t1.digest
WHERE schema_name NOT IN ('performance_schema', 'sys')
ORDER BY (total_latency / exec_count) DESC
LIMIT 2\G
Sample output:
*************************** 1. row ***************************
      schema_name: employees
          tot_lat: 1.85 h
       exec_count: 61
 latency_per_call: 1.82 min
query_sample_text: SELECT DISTINCT e.emp_no, e.first_name, e.last_name, MAX(s.salary) AS highest_salary
                   FROM employees e
                   JOIN salaries s ON e.emp_no = s.emp_no
                   GROUP BY e.emp_no, e.first_name, e.last_name
                   HAVING highest_salary > 120000
                   ORDER BY highest_salary DESC
                   LIMIT 10

*************************** 2. row ***************************
      schema_name: employees
          tot_lat: 26.00 min
       exec_count: 37
 latency_per_call: 42.16 s
query_sample_text: SELECT e.emp_no, e.first_name, e.last_name, s1.salary AS initial_salary, s2.salary AS recent_salary
                   FROM employees e
                   JOIN salaries s1 ON e.emp_no = s1.emp_no
                   JOIN salaries s2 ON e.emp_no = s2.emp_no
                   WHERE s1.to_date < s2.from_date
                   AND s1.salary > s2.salary
                   AND s2.to_date = '9999-01-01'
Identifying Full Table Scans
You can also find queries that trigger full table scans:
SELECT query,
       db,
       exec_count,
       format_pico_time(total_latency) AS total_latency,
       rows_examined
FROM sys.x$statements_with_full_table_scans
ORDER BY total_latency DESC
LIMIT 2;
Sample output:
| SELECT DISTINCT e.emp_no, e.first_name, e.last_name, MAX(s.salary) AS highest_salary
  FROM employees e
  JOIN salaries s ON e.emp_no = s.emp_no
  GROUP BY e.emp_no, e.first_name, e.last_name
  HAVING highest_salary > 120000
  ORDER BY highest_salary DESC LIMIT 10

| SELECT e.emp_no, e.first_name, e.last_name, s1.salary AS initial_salary, s2.salary AS recent_salary
  FROM employees e
  JOIN salaries s1 ON e.emp_no = s1.emp_no
  JOIN salaries s2 ON e.emp_no = s2.emp_no
  WHERE s1.to_date < s2.from_date
  AND s1.salary > s2.salary
  AND s2.to_date = '9999-01-01'
Working on These Queries
As shown above, both pt-query-digest and the sys schema help identify the same set of top-consuming queries when measured by latency. Assuming these queries are already optimized and indexed properly, the next step is considering other alternatives such as increasing resources or caching solutions.
In a previous blog post, I explored and tested performance improvement strategies by comparing vertical and horizontal scaling approaches, including the use of Readyset. You can read it here.
To summarize, Readyset acts as a transparent caching layer. In this example, even partial support, just one of the two top queries (as seen in the “Readyset supported” column, can lead to meaningful reductions in database load.
mysql> SHOW PROXIED QUERIES;
+--------------------+-------------------------------------------------------------------------------------------------------------------------------------------------------------------------------------------------------------------------------------------------------------------------------------------------------------------------------------------------------------------------------------+--------------------+-------+
| query id           | proxied query                                                                                                                                                                                                                                                                                                                                                                       | Readyset supported | count |
+--------------------+-------------------------------------------------------------------------------------------------------------------------------------------------------------------------------------------------------------------------------------------------------------------------------------------------------------------------------------------------------------------------------------+--------------------+-------+
| q_cc3975f2c1fa2371 | SELECT `e`.`emp_no`, `e`.`first_name`, `e`.`last_name`, `s1`.`salary` AS `initial_salary`, `s2`.`salary` AS `recent_salary` FROM `employees` AS `e` JOIN `salaries` AS `s1` ON (`e`.`emp_no` = `s1`.`emp_no`) JOIN `salaries` AS `s2` ON (`e`.`emp_no` = `s2`.`emp_no`) WHERE ((`s1`.`to_date` < `s2`.`from_date`) AND ((`s1`.`salary` > `s2`.`salary`) AND (`s2`.`to_date` = $1))) | yes                |     0 |
| q_f2b54bb91c39d8de | SELECT DISTINCT `e`.`emp_no`, `e`.`first_name`, `e`.`last_name`, max(`s`.`salary`) AS `highest_salary` FROM `employees` AS `e` JOIN `salaries` AS `s` ON (`e`.`emp_no` = `s`.`emp_no`) GROUP BY `e`.`emp_no`, `e`.`first_name`, `e`.`last_name` HAVING (`highest_salary` > 120000) ORDER BY `highest_salary` DESC                                                                   | unsupported        |     0 |
+--------------------+-------------------------------------------------------------------------------------------------------------------------------------------------------------------------------------------------------------------------------------------------------------------------------------------------------------------------------------------------------------------------------------+--------------------+-------+
2 rows in set (0.00 sec)
Once the query is cached, query execution time drops significantly:
mysql> CREATE CACHE FROM q_cc3975f2c1fa2371;
Query OK, 0 rows affected (21.09 sec)
# Before caching:
mysql> SELECT e.emp_no, e.first_name, e.last_name, s1.salary AS initial_salary, s2.salary AS recent_salary   FROM employees e   JOIN salaries s1 ON e.emp_no = s1.emp_no   JOIN salaries s2 ON e.emp_no = s2.emp_no   WHERE s1.to_date < s2.from_date   AND s1.salary > s2.salary   AND s2.to_date = '9999-01-01';
06721feb72235f72c572b98646d651d4  -
6205 rows in set (1 min 0.94 sec)
# After caching:
mysql> SELECT e.emp_no, e.first_name, e.last_name, s1.salary AS initial_salary, s2.salary AS recent_salary   FROM employees e   JOIN salaries s1 ON e.emp_no = s1.emp_no   JOIN salaries s2 ON e.emp_no = s2.emp_no   WHERE s1.to_date < s2.from_date   AND s1.salary > s2.salary   AND s2.to_date = '9999-01-01';
06721feb72235f72c572b98646d651d4  -
6205 rows in set (0.02 sec)
I won’t go into the installation or usage details of Readyset in this post, but you can find the complete guide in the official documentation.
Conclusion
Query optimization isn’t just about chasing slow queries, it’s about understanding your workload and focusing your efforts where they have the greatest impact. In real-world systems, a handful of high-frequency queries often dominate resource usage. By applying the Pareto principle to query analysis, DBAs can prioritize work that yields the highest return in performance.
Tools like pt-query-digest, the Performance Schema, and the sys schema provide different but complementary lenses through which to view query behavior. They help uncover both the obvious and the subtle inefficiencies in your database workload. Once you’ve identified your top contributors, caching with Readyset can take optimization further by reducing execution time to milliseconds, even under concurrent load, without touching application code.
The key takeaway is that performance tuning doesn’t always mean rewriting queries or scaling hardware. Sometimes, it means stepping back, analyzing patterns, and applying the right combination of observability and modern caching strategies. Whether you’re troubleshooting a specific incident or planning broader system improvements, having the right insights and tools enables you to work strategically, delivering faster systems, better user experiences, and more stable infrastructure.
Boost MySQL/PostgreSQL Performance With Readyset
References
- If I Should Optimize Only One Query on My Application, Which One Should It Be? – lefred.be (by Frederic Descamps)
- Digest Query Samples in Performance Schema – lefred.be (by Frederic Descamps)
- MySQL 8.4 Reference Manual: slow_query_log Variable – dev.mysql.com
- Vertical Scaling of MySQL vs. Horizontal Scaling with Readyset: A Cost and Performance Analysis in the Cloud – Readyset Blog
- Performance Schema Query Profiling – dev.mysql.com
- pt-query-digest Documentation – Percona Toolkit Docs
Related articles
Continue reading more about query optimization.
Query Optimization Readyset
Readyset Now Supports SQL Window Functions.
We're excited to announce that Readyset now supports SQL Window Functions. This powerful addition means you can now cache more of your complex queries without modifying a single line of application code, bringing the performance benefits of Readyset to an even broader range of use cases. What Are Window Functions? Window Functions are one of SQL's most powerful features for analytical queries. They let you perform calculations across rows that are related to the current row, without needing c
2025-08-26·2 min read

Query OptimizationVinicius Grippa
Optimizing SQL Pagination in MySQL
In our blog post on Optimizing SQL Pagination in Postgres, we explained how to optimize SQL pagination for Postgres. As a counterpart, we’ve decided to write one for MySQL pagination. Like PostgreSQL, MySQL offers several ways to handle pagination, but some are far more efficient than others. Let's break down the SQL Pagination options, talk about why LIMIT and OFFSET can be a problem, and look at smarter ways to paginate large datasets efficiently. The Classic SQL Pagination Approach: LIMIT
2025-03-17·6 min read
Query Optimization Marcelo Altmann
Demystifying EXPLAIN and EXPLAIN ANALYZE
You've crafted the ideal SQL query. It's beautiful. A work of art. Then, it takes seconds to execute and hangs your entire application. What went wrong? You need a way to look under the hood of SQL and understand the inner workings of your query. “Under the hood” is precisely what the EXPLAIN and EXPLAIN ANALYZE commands were built for–to guide you through the labyrinth of query optimization. These offer a glimpse into the database optimizer, revealing how your query is executed and identifying
Marcelo Altmann2024-11-13·11 min read
Still scaling the hard way?
Modern applications demand instant performance, even under unpredictable load. Readyset helps you eliminate slow queries, stabilize latency, and scale confidently.
Revolutionize your database performance with Readyset
Serve requests at sub-millisecond latencies with the modern database scaling and query caching system for MySQL and PostgreSQL.
Join our newsletter
Stay updated with the latest news, insights, and developments from Readyset — straight to your inbox.