
← Back to blogDatabase Caching
Cache Invalidation for SQL Queries: How to stop writing it yourself
Cache invalidation is the hardest part of caching SQL queries. Here's why TTLs and manual keys break, and how incremental view maintenance avoids both.
Vinicius Grippa
2026-09-21 · 25 min read
Cache invalidation is the problem of knowing when a cached query result has gone stale and needs replacing. A write changes one row in the database, and every cached answer derived from that row is now wrong. The work is finding those answers and dropping or refreshing them before the next read.
Say you have a read-heavy application and you've been asked to make reads faster. You put a cache in front of the database, the read path gets fast, and that invalidation work lands in your write path as a short list of rules. Here are the rules:
- If a vote arrives, drop that story's key.
- If a title changes, drop that story's key.
- If an account is renamed, drop that user's key.
One rule per table. It reviews cleanly and it ships.
One of those three rules is wrong. The page it breaks keeps serving stale data until something unrelated evicts the entry.
We wanted to know what that mistake actually costs, and how the alternatives compare when they see identical writes. So we built a lab and measured six read paths against one workload.
Why one of those rules is wrong
Writing one of those rules wrong is easy. Here is the mistake in full, with the schema on the page. Three tables, quoted from Figure 2 of the Noria paper:
CREATE TABLE stories (id int, author int, title text, url text);
CREATE TABLE votes   (user int, story_id int);
CREATE TABLE users   (id int, username text);
The lab adds a primary key to each of the three tables.
A story page reads across all three. It needs a title from stories, a display
name from users, and a count from votes, and all three collapse into a single
cache key. So a cached result is not a copy of a row. It is an answer derived
from rows in several tables, and no one of those tables can say which cached
answers depend on it.
The code that writes knows which row it changed. The cache knows which key it holds. The mapping between the two lives in exactly one place, the text of the read query, and the read query sits nowhere near the write path:
SELECT s.id, s.title, u.username
  FROM stories s JOIN users u ON u.id = s.author
 WHERE s.id = ?;
The edge that matters is u.id = s.author. It says that changing a user dirties
story pages. Nothing in the users table mentions a story, so the rename rule has
no way to find the keys it just falsified. It drops a user key that this page never reads,
and every story by that author keeps serving the old name.
Nothing catches this. A cache entry that should have been dropped and was not raises no error. It returns a plausible name, on the instances that happen to hold it, only for entries populated before that particular write. It will not reproduce on a laptop where the cache is empty, which is why this class of bug tends to be found by a user rather than by a test.
Almost nobody attempts precise invalidation
A 2023 survey by Ji, Zhou, Zhou and Wang analysed 20 Spring-cache web applications and surveyed more than 50 engineers. Of the cached methods they counted, 80.6% used a time to live or coarse-grained invalidation (dropping every cache entry associated with a table or namespace, rather than working out which specific entries a write affected), and only 10.4% attempted fine-grained invalidation.
Four out of five cached results in real projects do not attempt the mapping. They accept staleness instead. The authors' explanation of why:
All the aforementioned cases converge on a single fundamental challenge: the absence of a link between database updates and cache entries at the application level, making precise cache invalidation difficult to achieve.
Their examples are ordinary. One delete method issues 11 SQL statements across 9 tables, so no application-level rule can say what it dirtied. Another caches a query with range predicates, where deciding whether an update changes the result means evaluating the predicate.
Even teams who do this well find it hard. Meta's Polaris service exists to detect cache inconsistencies that reach production, and it moved TAO, the store behind Facebook's social graph, from 99.9999% to 99.99999999% consistency. Before Polaris, roughly one write in a million was silently wrong, and it took a purpose-built service to find out.
Cache invalidation strategies for SQL queries
Four strategies are in common use:
Time to live. Do not track dependencies at all. Put an expiry on each cached result and re-read the query when it lapses. This is the most widely used strategy because it is the only one with no invalidation code, and the trade is that the cache is correct within N seconds, and you chose N. A TTL cache also never learns that anything changed, so it re-reads on a schedule whether the underlying rows moved or not.
Manual cache keys, the Redis model. Store each result under a key the application chooses and delete those keys from the write path. Precise in principle. The cost is that the write path has to invert the read query by hand, and a missed edge is silent.
Event-driven invalidation. Read the database change stream, the MySQL binlog or the Postgres write-ahead log, and invalidate from it. Moving the trigger out of the application removes the race between a write and its invalidation, which is a real gain. The mapping stays. The team still writes and maintains the code that turns a changed row into the cache keys it affects, now in a stream processor rather than in a write path.
Incremental view maintenance. Apply each change to the stored result instead of discarding it. There is no invalidation step to write, because nothing is deleted.
| Strategy | Who writes the invalidation | When the cached result is wrong | Cost of a write |
|---|---|---|---|
| Time to live | Nobody | Up to the length of the window, after every write | None, but refreshes run on a clock whether or not anything changed |
| Manual cache keys | The application, per query | Until eviction, whenever the mapping misses an edge | The invalidation, plus a burst of misses behind it |
| Event-driven invalidation | The application, in a stream processor | Until the mapping is corrected | Stream processing, plus the burst of misses |
| Incremental view maintenance | Nobody | Only while the change propagates | Maintenance work inside the dataflow graph |
The rest of this post measures the first, the second and the fourth against each other on one schema. One write workload.
How we measured it
The lab runs on the three tables declared above, stories, users and votes,
seeded at the scale the
Noria paper reports for
production Lobsters: 10,000 users, 40,000 stories and 500,000 votes. Six read
paths served the same story page under one write workload, and saw exactly the
same writes. Readyset runs with its query sampler off throughout.
The six paths:
- MySQL directly, no cache, as a control
- Redis look-aside with the three-rule invalidator, whose rename rule drops a user key and leaves every story page by that author wrong
- Redis look-aside with a corrected invalidator
- Readyset shallow cache, fixed 10 s TTL with a 5 s refresh
- Readyset shallow cache with adaptive refresh
- Readyset deep cache, which maintains the result incrementally, a technique called incremental view maintenance and abbreviated IVM in the tables that follow
Reads have to be continuous, or the number measures the cache miss instead of the cache: burst-reading a TTL cache reports 12 ms staleness where continuous reading of the same cache reports seconds. The write interval also has to be jittered. With a fixed interval, two runs of an identical configuration produced 4,783 ms and 177 ms, both arithmetically correct and both meaningless, because the answer was set by the phase relationship between the write clock and the cache's refresh clock.
What the control is measuring
The control path has no cache, so it cannot be stale. It is there to measure the instrument.
The clock starts when the write commits and stops when a reader first sees the new value, so the control's number is whatever that detection costs. Readers issue one query and read back to back with no pause between reads, which puts the control at 0.19 ms, and each observation is bracketed to 0.28 ms by the read that caught it. Every number in this post is measured at that resolution.
Two corrections: the readers used to sleep 2 ms between reads, so a write landed uniformly inside a detection window and half that window showed up as staleness. And each poll ran both cached queries while inspecting only the vote count, paying for a query it never used. Removing the sleep and the spare query moved the control from 2.00 ms to 0.19 ms.
Staggering more reader threads, which looks like the obvious fix, does nothing. For N readers at interval T the aggregate grid is T/N and the read load is N/T. So grid spacing is one over the load, and four readers at 8 ms is the same grid as one reader at 2 ms. The lever is aggregate read rate. Taking the sleep out reaches a grid of one round trip with a single thread.
Does the cache ever become correct?
In ten trials we warmed every path, renamed an author, then read continuously for 45 seconds and recorded when each path first returned the new name.
| Read path | Converged | Never converged |
|---|---|---|
| no cache (control) | 10 | 0 |
| look-aside, three-rule invalidator | 0 | 10 of 10 |
| look-aside, corrected invalidator | 10 | 0 |
| Readyset shallow, fixed refresh | 10 | 0 |
| Readyset shallow, adaptive refresh | 10 | 0 |
| Readyset deep (IVM) | 10 | 0 |
Ten out of ten. Every other path recovers. The three-rule invalidator never did, and in production the entry would stay wrong until unrelated memory pressure evicted it. That makes the bug's lifetime a property of the Redis eviction policy rather than of anything in the application.
The fix is more expensive than it looks. The rename rule has to ask the database
which stories that author wrote, because that is the only way to learn which keys
were dirtied. That puts
a SELECT in the write path, with a fan-out equal to the number of stories the
author has written, which is unbounded and largest for exactly the accounts that
matter most. It also writes the join down a second time, so adding a column to
the cached page means finding every write path that can touch it, again, with
nothing to signal a miss.
How stale each cache gets
A vote arrives and the count changes. This is the write path the three-rule invalidator handled correctly, so it is the fairest comparison. Three runs of sixty writes, medians across runs.
| Read path | p50 | p95 | Excess over the uncached control, p50 |
|---|---|---|---|
| no cache (control) | 0.19 ms | 0.40 ms | n/a, this is the control |
| look-aside, corrected invalidator | 1.11 ms | 1.57 ms | 0.92 ms |
| Readyset shallow, fixed refresh | 2.68 s | 4.74 s | 2.68 s |
| Readyset shallow, adaptive refresh | 2.29 s | 4.28 s | 2.29 s |
| Readyset deep (IVM) | 1.66 ms | 2.17 ms | 1.48 ms |
60 writes per run, 3 runs, medians across runs. Readers poll back to back at about 3569 reads/sec, so the instrument brackets each observation to 0.28 ms.
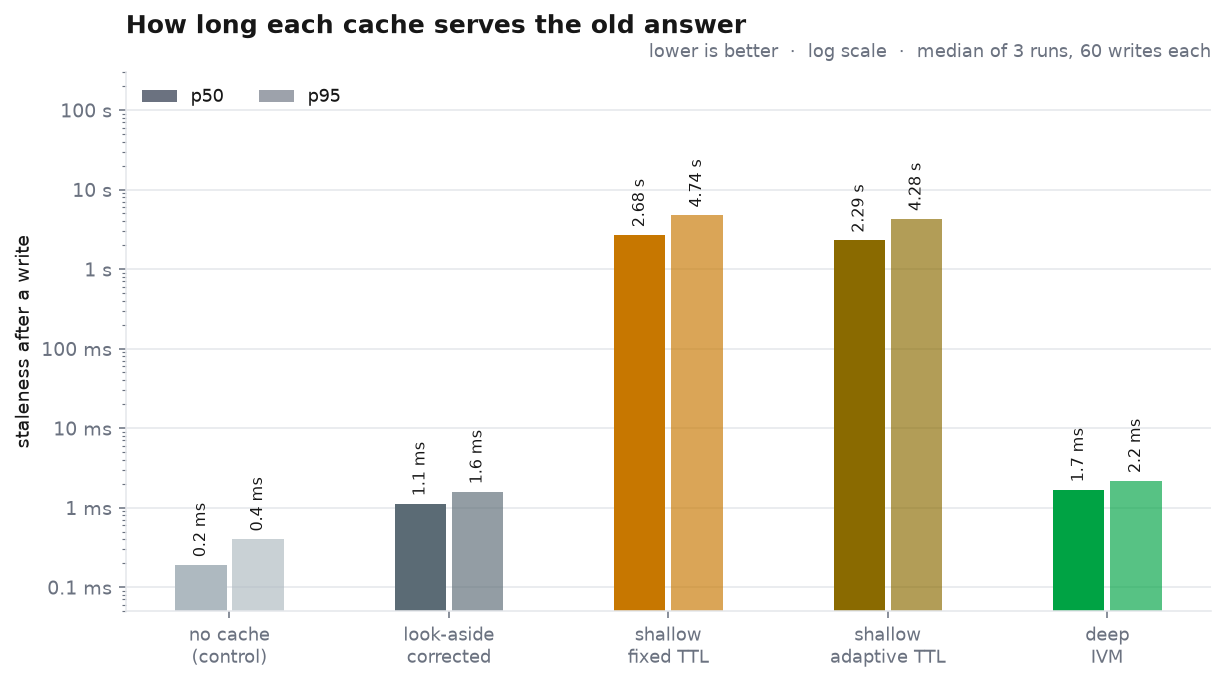
The TTL caches sit between two and five seconds behind. That is what a TTL is. With a 5 s refresh and uniformly phased writes, half the reads land in the first half of a refresh period, so the theoretical p50 is 2.5 s. Measured 2.68 s. Adaptive refresh helped a little and it can't help much, because it moves each entry's period between 10% and 100% of the configured value, so a 5 s refresh has a floor of 500 ms.
The look-aside cache is marginally the freshest of the three. At 1.11 ms it is about half a millisecond ahead of incremental view maintenance at 1.66 ms. Two conditions are doing work behind that number: the query is cheap, and the write rate is one write every seven seconds. That ordering makes sense once you look at what each one does with a write. A look-aside cache deletes the entry and lets the next reader refetch, so what it serves next is whatever MySQL has at that instant. Incremental view maintenance has to carry the write through the binlog and the dataflow graph before the stored result changes, and on this schema that costs about 1.5 ms over an uncached read.
So on the write path a hand-written invalidator gets right, it wins by half a millisecond. A harness that shows otherwise is probably measuring itself.
The advantage lasts only while the query is cheap
The story-page probe query is two indexed point lookups. When the look-aside cache throws its entry away, refetching costs about a millisecond, which is why deleting and refetching looks free. A query like that is rarely worth caching. The reason to cache is that recomputing is expensive.
So the same measurement, on a query with no index to lean on:
SELECT user, COUNT(*) AS c FROM votes WHERE user = ? GROUP BY user;
votes is indexed on story_id, not on user, so this is a full scan of about
500,000 rows and takes roughly 35 ms on this machine. Twenty-five writes, same
method:
| Read path | Staleness p50 | Staleness p95 | One read, p50 |
|---|---|---|---|
| no cache (control) | 59 ms | 102 ms | 36.62 ms |
| look-aside, corrected invalidator | 42 ms | 51 ms | 0.16 ms |
| Readyset deep (IVM) | 1.48 ms | 1.96 ms | 0.23 ms |
The ordering inverts, and the deep cache is now about 28 times fresher rather than half a millisecond behind.
Read the last column next to the first. Both caches answer a single read in a fraction of a millisecond, so both are doing their job as caches. Their staleness differs by a factor of 28 because they recover from a write differently. A look-aside cache recovers by recomputing, so its staleness can never be lower than what the query costs. Incremental view maintenance recovers by applying one delta to the stored result, so its cost is set by the size of the change rather than the size of the scan, and it did not move between the cheap query and this one.
The uncached control is the same story from the other side: at 59 ms it is not stale, it is just slow, and every one of those milliseconds is work the database repeats on every read.
The TTL cache, given its best shot
Comparing against a fixed refresh period alone would be unfair, so the lab also runs
Readyset's shallow cache with ADAPTIVE. Each entry's refresh period then moves
between 10% and 100% of the configured value. The cache hashes each refreshed result,
shrinks the period when the value changed, and grows it when it did not.
Adaptive refresh did engage: across the three runs the vote-count entry recorded 197 refreshes that found a change against 199 that did not, an almost exactly even split. Adaptation has nothing to bite on in that case, because the shrink and the grow are the same size and cancel, and the staleness reflects it: 2.29 s against 2.68 s, an improvement of about 15%.
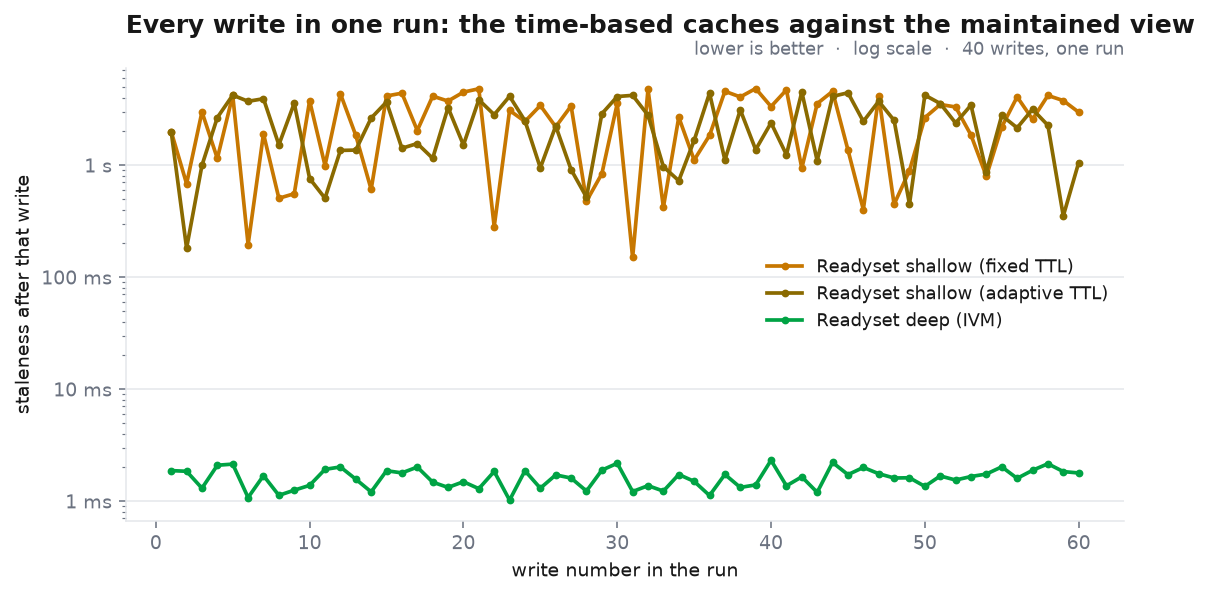
Plotted per write, the two time-based lanes wander over the same range. The maintained view sits three orders of magnitude below both, on every write rather than on average:
What an invalidation costs beyond the invalidation
Deleting a hot key produces one cache miss per reader in flight, all at the same instant, all issuing the query to the database the cache was supposed to protect.
We put 32 readers on one story and wrote to it once every ten seconds, counting with
MySQL's own Com_select so the harness could not inflate the number.
| Read path | SELECTs in the write second | In a quiet second | Increase |
|---|---|---|---|
| look-aside, corrected invalidator | 66 | 2 | 33x |
| Readyset shallow, fixed refresh | 2 | 2 | none |
| Readyset shallow, adaptive refresh | 2 | 2 | none |
| Readyset deep (IVM) | no write-correlated increase | none |
60 s per arm, one write every 10 s. Com_select is MySQL's own counter.
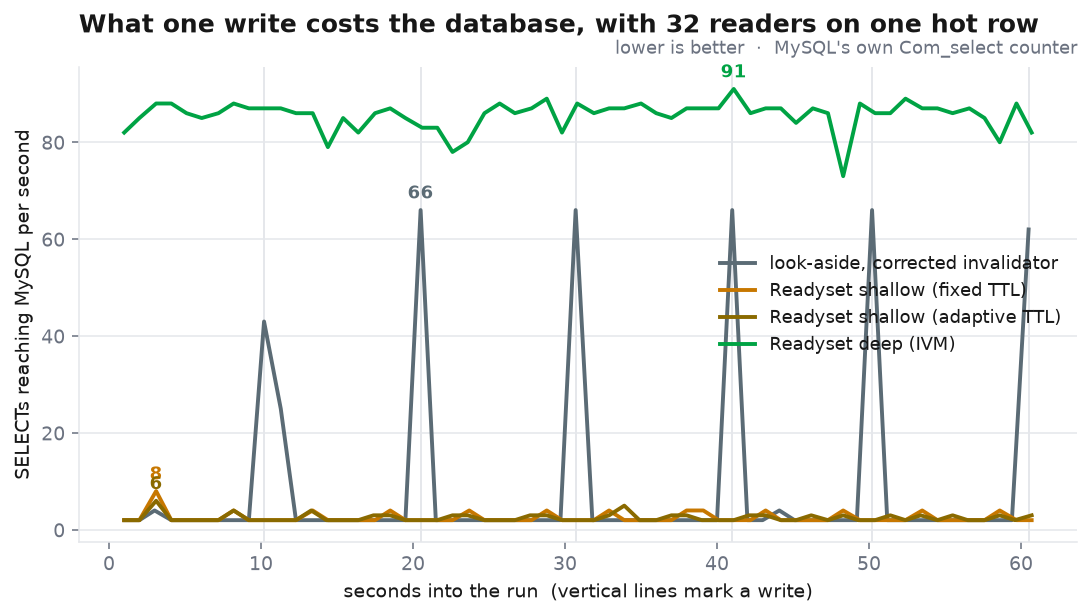
Sixty-six is 32 readers times the two queries a story page needs, plus the couple of background queries present in a quiet second. One vote produced thirty-three times the steady query rate, in one second, against the database the cache exists to shield.
This is what the look-aside cache's half-millisecond freshness advantage costs. It is fresher because it throws the entry away and asks MySQL again, and asking MySQL again is the expensive part. Making its connection handling realistic, which is what closed the gap on the staleness table, did not soften the burst. It made the burst arrive sooner.
Neither Readyset path shows a spike, for different reasons. The TTL cache never learns that the write happened, so nothing changes at write time. The deep cache learns immediately and updates the stored result in place, so there is no entry to refill and no reader to send upstream.
The write rate is what decides this
Everything measured so far ran at one write every seven seconds on the probe row, which is one invalidation per roughly thirty thousand reads. That is the regime where a look-aside cache is at its strongest, because a look-aside cache is only useful in the gap between one invalidation and the next.
So the last measurement holds the readers constant and sweeps the write rate.
Sixteen readers on one row, arms run one at a time so Com_select attributes
cleanly, and the look-aside arm keeps every advantage it had: the invalidation is
still a function call in the writing thread, still one cache key, still no queue
and no second cache to fan out to.
| Writes/sec on the row | Design | Cache hit rate | SELECTs/sec reaching MySQL | Writes behind, p50 | Writes behind, p95 |
|---|---|---|---|---|---|
| 0.1 | look-aside, corrected invalidator | 100.0% | 5 | 0 | 0 |
| 0.1 | Readyset shallow, fixed refresh | 100.0% | 2 | 0 | 1 |
| 0.1 | Readyset deep (IVM) | 100.0% | 2 | 0 | 0 |
| 1 | look-aside, corrected invalidator | 99.9% | 35 | 0 | 0 |
| 1 | Readyset shallow, fixed refresh | 100.0% | 2 | 2 | 5 |
| 1 | Readyset deep (IVM) | 100.0% | 2 | 0 | 0 |
| 5 | look-aside, corrected invalidator | 99.5% | 163 | 0 | 0 |
| 5 | Readyset shallow, fixed refresh | 100.0% | 2 | 11 | 23 |
| 5 | Readyset deep (IVM) | 100.0% | 2 | 0 | 0 |
| 20 | look-aside, corrected invalidator | 97.9% | 641 | 0 | 0 |
| 20 | Readyset shallow, fixed refresh | 100.0% | 2 | 45 | 94 |
| 20 | Readyset deep (IVM) | 100.0% | 2 | 0 | 0 |
| 50 | look-aside, corrected invalidator | 94.3% | 1600 | 0 | 1 |
| 50 | Readyset shallow, fixed refresh | 100.0% | 2 | 111 | 235 |
| 50 | Readyset deep (IVM) | 100.0% | 2 | 0 | 1 |
30 s per point, arms run one at a time so Com_select attributes cleanly. The look-aside arm is deliberately at its best case: invalidation in the writing thread, one cache key, no queue and no fan-out.
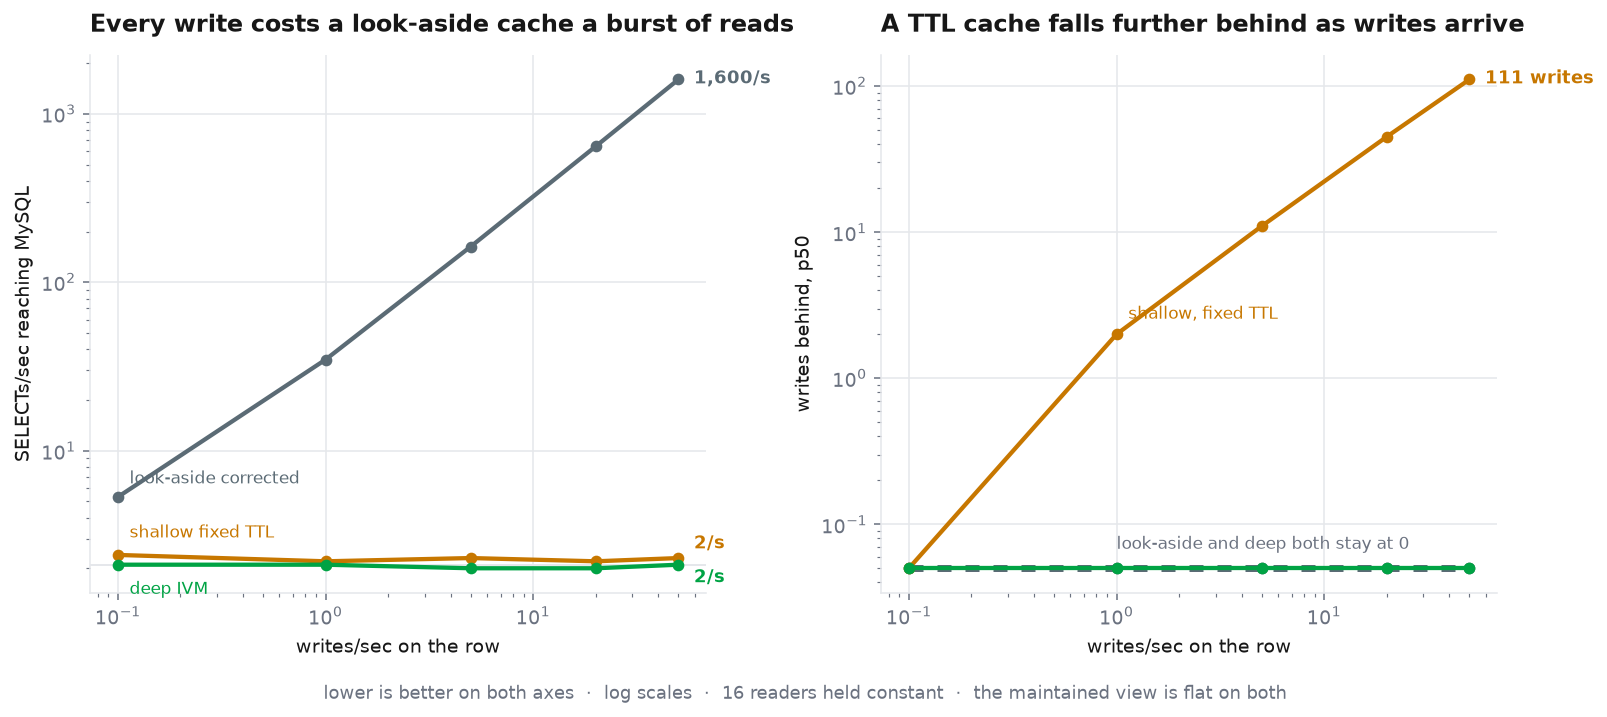
The two panels are the two different bills a cache can be handed, and each design pays only one of them.
The left panel is what the database pays: how many SELECTs per second reach MySQL while a cache is in front of it. The right panel is what the reader pays: how many writes behind the cached answer is when someone reads it. Both axes are log scaled, so a straight rising line is a proportional increase, and lower is better on both. A genuinely free design would be a flat line near the bottom of each panel.
As the write rate climbs, only one of the three changes is about staleness.
The look-aside cache stays current and sends the bill to the database. Its upstream load goes from 5 SELECTs per second to 1,600, a 302-fold rise across the sweep, tracking write rate times reader count almost exactly: 50 writes times 16 readers times the two queries a rebuild needs is 1,600. It is still fresh at 50 writes per second. It is fresh because it is asking MySQL sixteen hundred times a second about a row whose answer changed fifty times.
Its hit rate over that same sweep goes from 99.99% to 94.27%, and the two readings of that pair disagree completely:
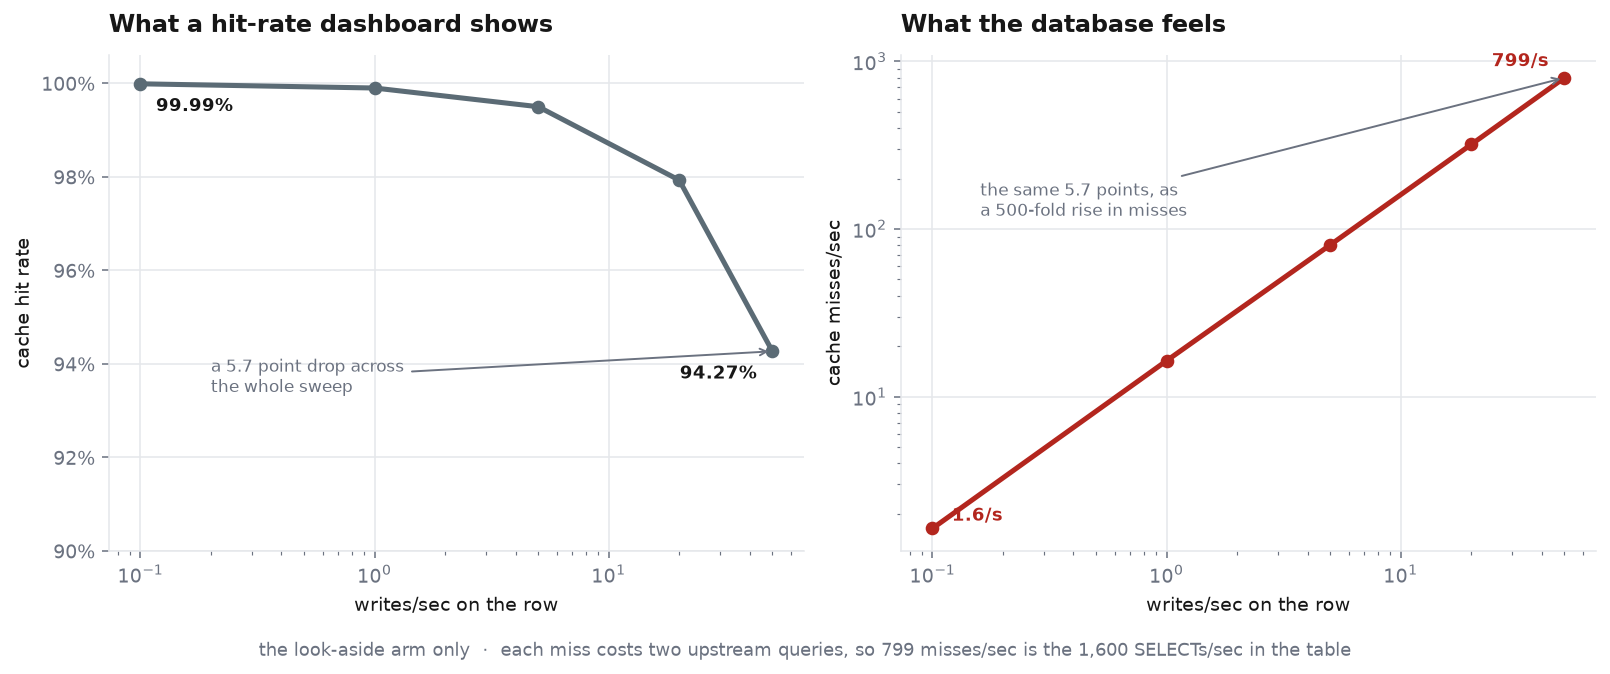
On the left is what a hit-rate dashboard shows: a 5.7 point drift, which on any monitoring page reads as a cache doing its job. On the right is the same 5.7 points expressed as the thing the database actually receives, and it is a rise from 1.6 misses per second to 799, a factor of five hundred. Each of those misses costs two upstream queries, which is exactly the 1,600 SELECTs per second in the table.
Hit rate is a ratio, and a database is not charged in ratios. At 94% and sixteen thousand reads per second, the 6% is 799 requests that have to be computed from scratch, every second, on top of the write traffic that caused them.
The TTL cache holds upstream load flat and pushes the cost onto the reader. Two SELECTs per second at every write rate, because it never learns that anything changed. What moves instead is how far behind it is: 2 writes at 1 per second, 11 at 5, 45 at 20, and 111 at 50, with a p95 of 235. A five second refresh window times fifty writes a second is what that number has to be.
The maintained view does not move on either axis. 100% hit rate, zero writes
behind, and none of the application's reads reaching MySQL at any write rate. The
two SELECTs per second in that column are SELECT VERSION() and a session
variable read, issued by Readyset's own connection to the database. Neither
touches a table. The write side is
doing more work at 50 writes per second than at 0.1, but the work is one delta per
write through a graph, and on this query it does not show up as either staleness or
database load.
A hand-written look-aside cache really is a shade fresher than incremental view maintenance, and it stays that way as the workload gets busier. It buys that by turning every write into a burst of reads against the database the cache exists to protect, and the bill grows with your write rate and your reader count at the same time.
What incremental view maintenance is
Incremental view maintenance keeps the stored result of a query up to date by
applying each change to that result, rather than recomputing the query or
discarding the result. A write becomes a delta, the delta flows through the
relational operators of the query, and the stored answer is rewritten in place. A
COUNT node receives "one more vote for story 1" and emits "the count for story 1
went from 7 to 8". There is no invalidation step, because nothing is deleted.
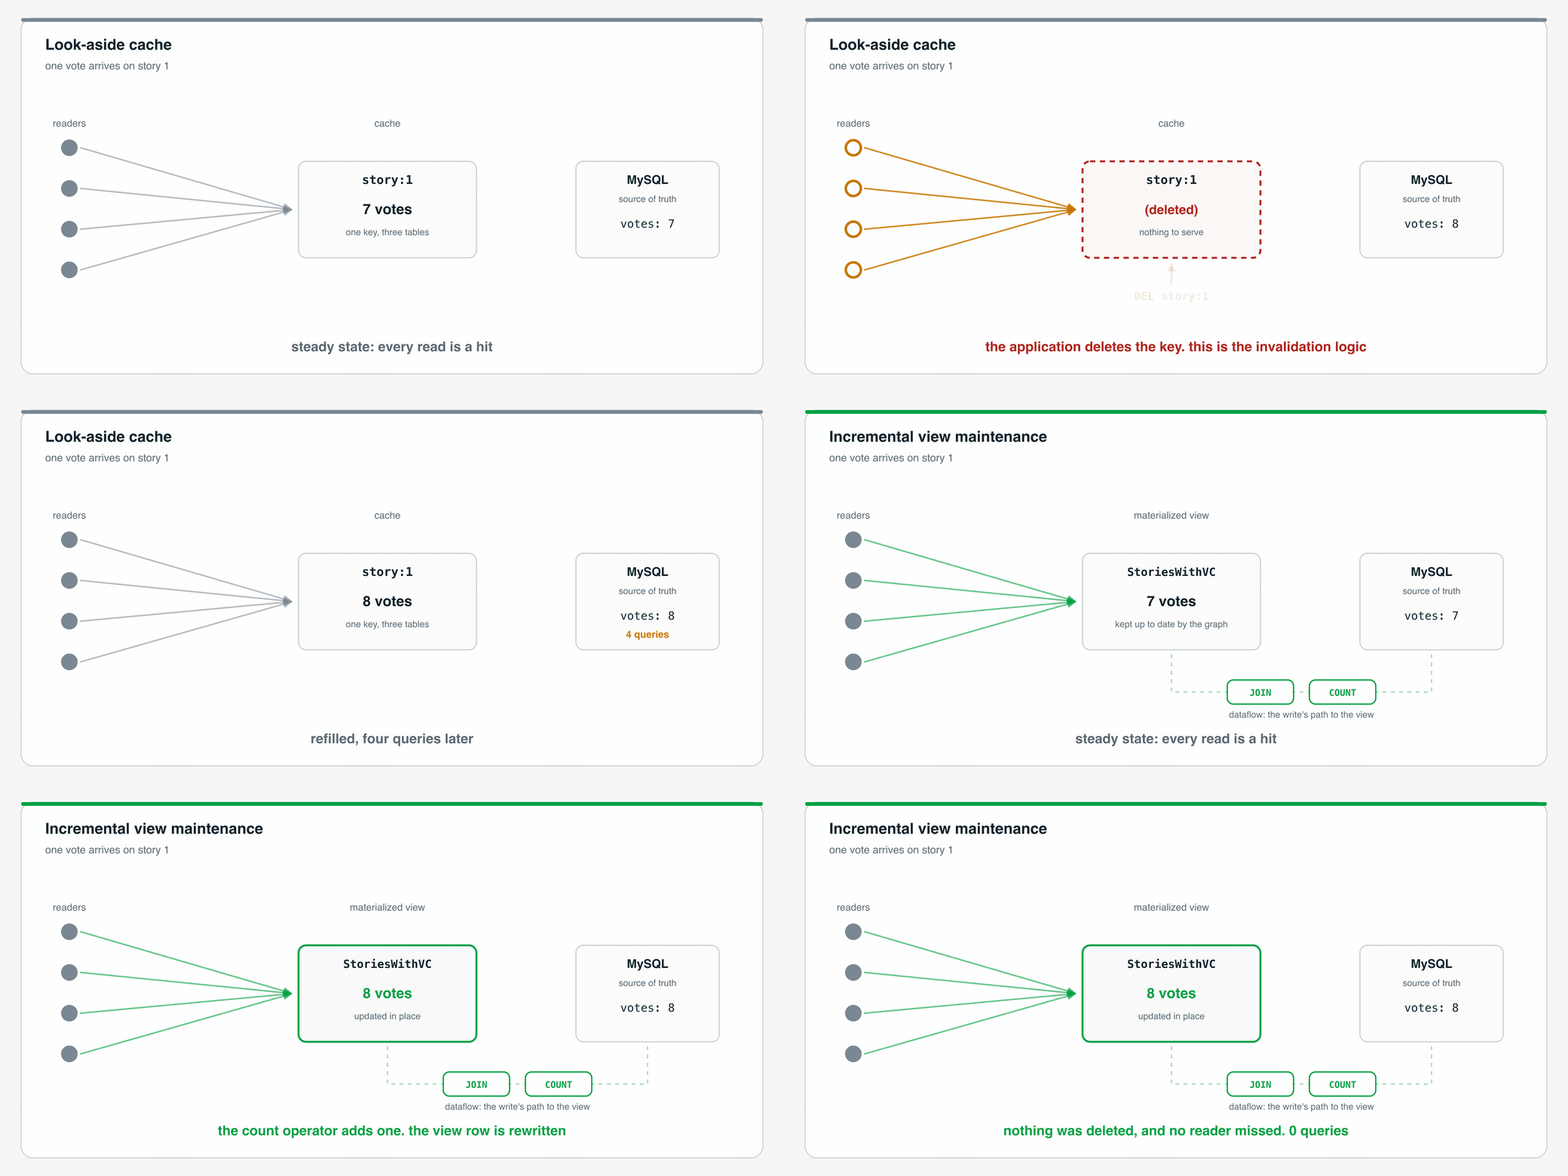
Incremental view maintenance has decades of literature behind it, and memory is what stopped it replacing caches. A maintained view is the whole answer set, so materializing every query an application runs costs more memory than the database. Streaming systems capped that by windowing, keeping only recent records, which is useless for an application that has to serve a four-year-old story as fast as this morning's.
The 2018 result that changed the memory problem
In October 2018 a group at MIT CSAIL published Noria: dynamic, partially-stateful data-flow for high-performance web applications at the 13th USENIX Symposium on Operating Systems Design and Implementation, the peer-reviewed systems conference usually shortened to OSDI. Noria is a database backend that compiles an application's SQL queries into a dataflow graph and keeps every one of their results materialized and current as writes stream in.
The paper builds on incremental view maintenance rather than inventing it. Its contribution is partially stateful dataflow, the mechanism that makes maintaining every query affordable enough to replace a cache rather than sit beside one. Readyset is the production descendant of that work. The project's own history file records the lineage: the codebase "builds on the Noria project, an open-source research prototype built by a team of grad students, post-docs, professors, and research affiliates at the MIT Parallel and Distributed Operating Systems (PDOS) lab, of which ReadySet's founding team was a part."
Partially stateful dataflow works like this. Operators are allowed to be incomplete: an operator holds only the entries that have actually been read, and treats a missing entry as a hole to fill on demand. A read for an absent key issues an upquery, which travels backwards up the dataflow graph to the operators that can recompute that entry, and the response flows forward along the normal path to fill the hole. Under memory pressure an operator evicts an entry and sends an eviction notice downstream, so everything derived from it is dropped rather than left quietly out of date.
Memory therefore tracks the working set instead of the table. In the paper's Lobsters measurements, partial state cut the state that could not be evicted to 73 MB, against 789 MB for full materialization over 137 MB of base tables.
Our lab shows the same shape. Reading K distinct story pages and asking Readyset
what it is holding, via readyset_reader_state_size_bytes:
| Distinct story keys read | Deep cache state | Bytes per key | Share of base tables |
|---|---|---|---|
| 0 | 0 KB | 0 | 0.00% |
| 100 | 45 KB | 464 | 0.22% |
| 1,000 | 453 KB | 464 | 2.17% |
| 5,000 | 2.2 MB | 464 | 10.84% |
| 20,000 | 8.9 MB | 464 | 43.37% |
| 40,000 | 17.7 MB | 464 | 86.74% |
40,000 stories exist. Base tables are 20.4 MB of data in MySQL. Metric: readyset_reader_state_size_bytes.
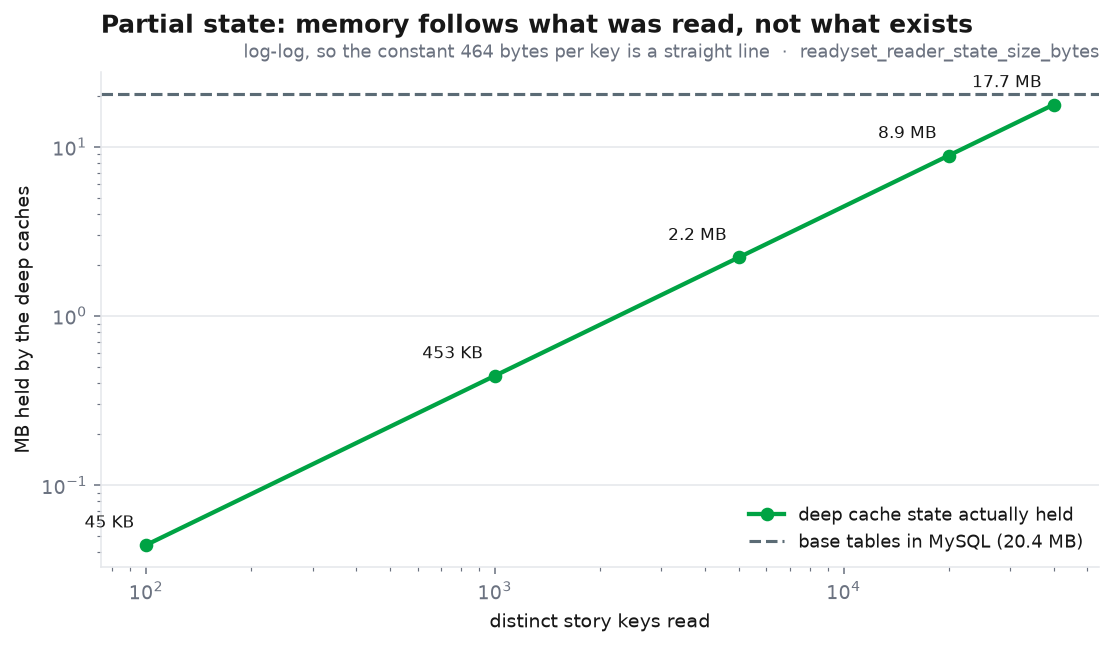
464 bytes per key, flat across three orders of magnitude, and nothing held for keys nobody asked for. Read a hundred story pages and the caches hold 45 KB against 20.4 MB of base tables. Read all 40,000 and they hold 17.7 MB, still under the base tables, which is the case partial state does nothing for because there is nothing partial about it any more.
The practical version: a deep cache is sized by the working set, the same rule already used for Redis.
How to cache expensive SQL queries automatically
A query is cached automatically when adding the cache needs no application change and keeping it correct needs none either. Readyset gives both. It speaks the MySQL and Postgres wire protocols, so the application connects with its existing driver, and a cache is one statement:
CREATE CACHE FROM
  SELECT s.id, s.title, u.username
    FROM stories s JOIN users u ON u.id = s.author WHERE s.id = 2;
The caching is automatic because the invalidation is automatic. Readyset keeps each cached result current with incremental view maintenance, driven by the MySQL binlog or the Postgres write-ahead log, so there is no invalidation step for the application to write. A caching layer that stores results and hands back an invalidation problem has automated the read path and left the write path alone. Teams comparing SQL query caching tools for MySQL usually weigh hit rates and latency, and the more useful question is what each tool requires in the write path.
The property to design around
Incremental view maintenance is eventually consistent. The Noria paper states the guarantee this way: if writes quiesce, all external views eventually hold results that are the same as if the queries had been executed directly against the base tables. Under two milliseconds is short, and it is still not zero and not a transaction, so a read-your-own-writes path belongs on the database rather than behind any cache, this one included.
Accepting that window is a design decision, and it is the same one already being made with a TTL, except that the window is milliseconds instead of seconds and it does not have to be chosen or tuned.
What this comes down to
The mapping from a write to the cached answers it falsified is a graph, and nothing in application code validates that graph. Four out of five projects in the survey reached the same conclusion and took the TTL, which trades correctness for a window.
Partial state is what makes replacing invalidation practical. On our schema it bought this: on a cheap query, a maintained view sat 1.66 ms behind the database and a correctly written look-aside cache beat it, at 1.11 ms, while a TTL cache sat 2.68 s behind. On a query expensive enough to be worth caching, the same look-aside cache sat 42 ms behind and the maintained view did not move from 1.48 ms, because one design recovers by recomputing and the other by applying a delta.
The look-aside cache also paid for its freshness on both queries with a burst of 66 queries into MySQL after every write. The maintained view produced no burst, needed no window chosen or tuned, and required no invalidation code, because in that design there is nothing to invalidate. The three-rule invalidator, meanwhile, is still serving the wrong author name.
For how the dataflow engine maintains a cached result, see deep caching and How Readyset Speeds Up Queries with Streaming Dataflow. For the TTL model and when it fits better, see shallow caching, and the CREATE CACHE reference for the statement itself.
Related articles
Continue reading more about database caching.
Database Caching Readyset Team
Introducing Adaptive Cache for Dynamically Managing Freshness
Readyset's shallow caches now tune their refresh rate per result, not per cache. Adaptive refresh speeds up the results that change and slows down the ones that don't, cutting p95 staleness by 97% versus a straight TTL while adding only 10% more refreshes.
Readyset Team2026-08-13·8 min read
Database CachingVinicius Grippa
Readyset Internals: The left-right pattern: lock-free cache
How does Readyset serve cached reads without ever taking a lock? Explore the mechanics and real-world benchmarks of the left-right pattern and its 1.2-nanosecond atomic pointer swap.
Vinicius Grippa2026-07-01·8 min read

Database CachingVinicius Grippa
Caching real GitLab queries on Azure Postgres with Readyset
GitLab on Azure Postgres is expensive once a few teams start hammering the REST API. The bill grows because Postgres has to serve the same project list, issue count, and dashboard rollup over and over again, on top of the real work (writes, search, CI metadata). The standard answer is to scale up: For example, D4ds_v5 to D8ds_v5 to D16ds_v5, same shape, double the price (check the pricing calculator). This post walks through a different answer. We put Readyset between GitLab and an Azure Databa
Vinicius Grippa2026-05-11·8 min read
Still scaling the hard way?
Modern applications demand instant performance, even under unpredictable load. Readyset helps you eliminate slow queries, stabilize latency, and scale confidently.
Revolutionize your database performance with Readyset
Serve requests at sub-millisecond latencies with the modern database scaling and query caching system for MySQL and PostgreSQL.
Join our newsletter
Stay updated with the latest news, insights, and developments from Readyset — straight to your inbox.